Quote of the day

“I find economics increasingly satisfactory, and I think I am rather good at it.”– John Maynard Keynes
Showing posts with label relative poverty. Show all posts

Sunday, 1 March 2020

Homelessness & austerity

Housing insecurity, homelessness, and populism: Evidence from the UK

Thiemo Fetzer, Srinjoy Sen, Pedro Souza 27 February 2020

A predominant issue facing the UK, and many other advanced economies, is a lack of affordable housing. With an overall inelastic housing supply and flatlining productivity growth, house prices have accelerated at a faster rate than incomes, worsening affordability. In the UK, the share of homebuyers with a mortgage declined from 37% in 2007 to 28% in 2017. This has allowed the private rented sector to thrive. The decline in new homebuyers has been nearly fully offset by a steady rise in the share of households renting from the private sector, which increased from 13% of households in 2007 to around 20% in 2017. 
Housing costs, especially for the lowest income groups, constitute a significant percentage of disposable income, and many OECD countries have social assistance schemes in place to help low-income households with the cost of renting. In the UK, housing benefit provides a means-tested support for low-income households to meet the cost of rented accommodation. The fiscal burden of this welfare benefit – which is mostly a transfer from taxpayers to property owners – is growing and accounted for £21.9 billion in public spending in 2017-18. What happens if such a benefit is suddenly and drastically lowered? 
In a new paper (Fetzer et al. 2019), we carefully trace out the fiscal, social, and economic implications of a drastic and persistent cut to housing benefit in the UK which was initiated by the Conservative-led coalition government in April 2011.

The fiscal shadow of housing benefit in the private rented sector

The Local Housing Allowance (LHA) was introduced in 2008 as a way to compute housing benefit. The aim was for housing benefit to be generous enough to ensure that private sector tenants would be able to afford the median level of rent for a property of specified size in a local housing market (formally, within defined broad rental market areas, or BRMAs). Naturally, linking housing benefits to local rents through the LHA implied that the increase in private sector rents had a direct impact on public spending. From April 2011, the allowance for different sized properties within a BRMA was cut so that instead of covering the median rent, it only covered the 30th percentile. In addition, ‘excess payments’ – whereby housing benefit claimants who had previously lived in slightly cheaper accommodation were allowed to keep the difference in the rent and the LHA applicable, up to a difference of £15 pounds per week – were immediately cut. The cuts implied a significant financial loss for existing housing benefit claimants.
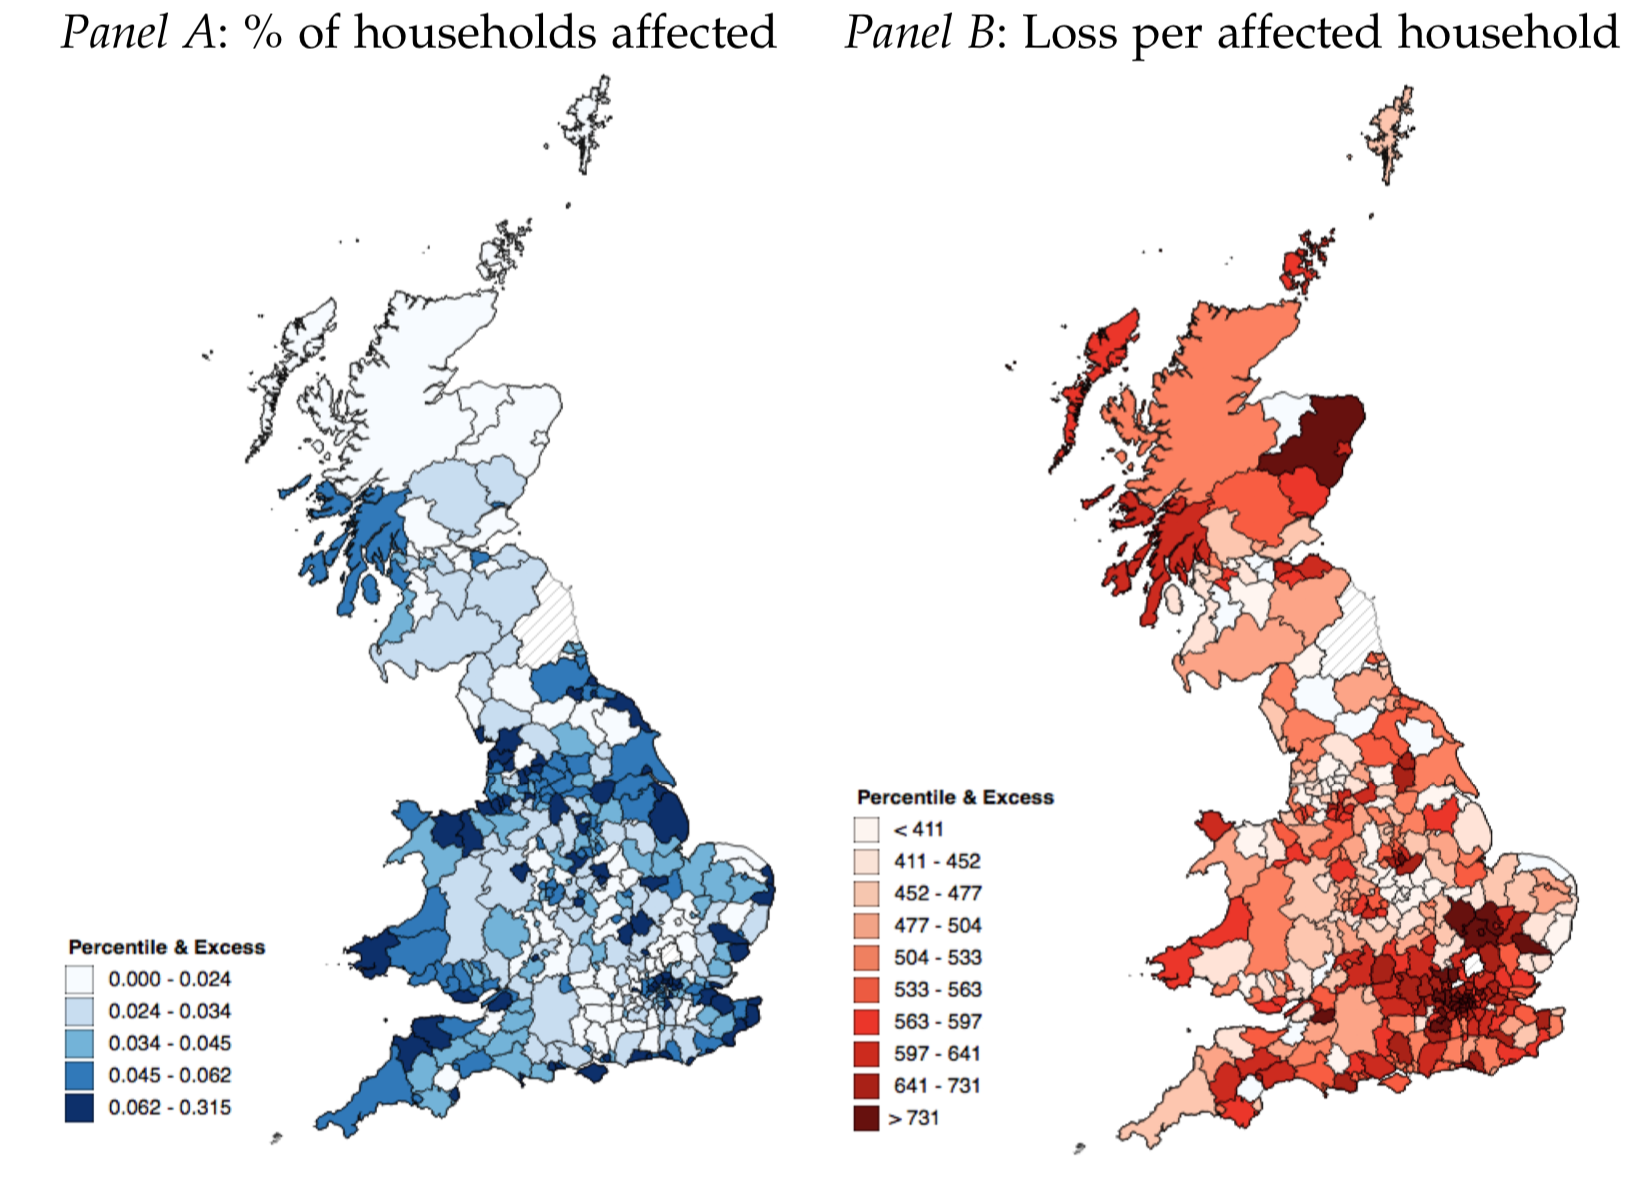
In late 2010, the Department for Works and Pension (DWP) conducted an economic impact assessment of the housing benefit cut using detailed administrative data. Panel A of Figure 1 presents data on the number of households affected expressed as a share of all resident households, while Panel B presents the spatial distribution of the average annual loss per affected household at the district level as observed from the DWP’s impact assessment of the LHA cut. The map highlights that there is significant variation across the UK in the intensity of the cut, with London clearly standing out as being among the worst affected areas. The average exposure to the cut amounted to an annual housing benefit reduction equivalent to £600 per affected household per year, rising to significantly more than £2,000 in many parts of London. Throughout the UK, around 0.9 million households in the private rented sector were affected by the cut – constituting around 5% of all households and up to 25% of all households in the private rented sector.
Figure 1 Ex-ante estimated impact of LHA cut from median to 30th percentile and the removal of the excess
We use these simultaneously introduced cuts to housing benefit to carefully trace out the fiscal, social, and economic impact of cuts to housing assistance. We mostly rely on extensive administrative data, leveraging these ex-ante projections to measure treatment intensity, and study the causal effects of the shock in a differences-in-differences framework with quite relaxed identifying assumptions. 

Effect on evictions, temporary accommodation, and homelessness

We find that a one standard deviation policy shock (a loss of approximately £546 per year per affected household) in private rented sectors led to a 22.1% increase in eviction actions on private sector tenants compared to the pre-reform period, with the numbers being higher in London. There is no discernible impact on eviction actions issued to the social rented sector, which acts as a good placebo test as housing benefit for these tenants was unaffected by the reform. This finding therefore reaffirms that the impact was only observed in the private rented sector, where evictions and repossession actions were carried out, mostly due to rent arrears, as a result of housing benefit claimants in this sector being directly affected by the LHA cuts. 
Households are considered to be in ‘statutory homelessness’ if the local authority considers that they do not have a right to occupy a property, or are at imminent risk of becoming homeless. Local councils have a statutory obligation to provide accommodation to these vulnerable households, which also often have a priority need. As a result of the sharp rise in evictions, we would expect an increase in demand for temporary accommodation which needs to be satisfied by the local councils who bear this statutory obligation. This is also reaffirmed in the data, with a one standard deviation policy shock leading to an increase in statutory homelessness and rough sleeping rates of between 10-13% and nearly 50%, respectively, along with a rise in households being placed in temporary accommodation of 18.8%.
Data provided by councils provide further evidence on who is affected by homelessness and why they became homeless. Since 2011, the structure of statutory homelessness has dramatically shifted, with rapid rises in homelessness concentrated in the working-age adult population and, in particular, among households with children. A one standard deviation increase in exposure to the housing benefit shock is associated with a 25% increase in the number of families with children being classified as homeless. The predominant reason why households become homeless in districts most exposed to the housing benefit cut is (legal) eviction from rented accommodation.

Individual-level evidence

Naturally, studying households in precarious living conditions using survey data is difficult, as these households may be particularly likely to move frequently from one accommodation to another, which may increase the risk that they drop out from such panel surveys. In the Understanding Society Panel Study, we find that between 40% and 50% of private rented sector tenants drop out from the panel study. For individuals that own their property (outright or with a mortgage), attrition rates are much lower at around 30%. Using the Understanding Society Panel Study, we highlight that attrition is likely an important margin: we find that   individuals (likely) exposed to the housing benefit cut were much more likely to drop out from the panel study after the reform took effect. We further show that it is these same individuals who are exposed to the benefit cut that report that they are increasingly falling into rent arrears rent in the most recent wave prior to them dropping out from the survey. This highlights that survey data, which are often used to inform policymaking, may be systematically skewed and not representative of vulnerable sample populations if there is policy-induced selective attrition.
For a small subsample of households that do not drop out from the survey, we further observe that individual-level exposure to housing benefit cuts is associated not only with increased rent arrears but also with a higher propensity to be evicted, mapping very closely to the results obtained from the district-level analysis.

Effect on electoral registration and the EU referendum vote

We also link exposure to the housing benefit cut to measures of democratic participation. The more descriptive results suggest that a one standard deviation increase in exposure to the housing benefit cut is associated with a non-negligible reduction in the electoral registration coverage rate (i.e. the ratio between the number of registered voters in a district and the number of voting-age adults in that district). We further document that a one standard deviation policy shock is associated with a fall in the official electorate for the 2016 EU referendum as a share of the voting-age population of 0.7-0.9 percentage points. The actual turnout for the referendum was significantly lower in districts more affected by the cut, with a one standard deviation increase in exposure to housing benefit cut leading to a fall in turnout of 1.3-1.8 percentage points. Lastly, we also observe that a one standard deviation increase in the level of exposure to the cut in a district is associated with up to a 2.2 percentage point greater level of support for ‘Leave’. This effect is likely driven by the composition of the electorate, as studies since the referendum have revealed that among those that did not turn out in the referendum, support for Remain outnumbers support for Leave by 2:1.

Fiscal neutrality 

The housing benefit cut dramatically increased statutory homelessness and rough sleeping, as mentioned above. Since local authorities have a statutory obligation to house households that are, or are at risk of becoming, unintentionally homeless, the local authorities had to rent properties, sometimes from private landlords and often at market rental rates, to provide temporary accommodation and other homelessness prevention services. Even though the cut to housing benefits was originally intended to provide fiscal savings to the DWP, we show that a large portion of the savings were offset by local council spending on anti-homelessness measures, thereby leading to a dramatic shifting of the burden from central to local government. This partially defeats the original object of the housing reform, which aimed to reduce fiscal exposure to rapidly rising market rents. Figure 2 illustrates the lower housing benefit spending by DWP and higher local council spending on anti-homelessness measures.
Figure 2 Cost-benefit analysis: Implied fiscal savings to central government from housing benefit cut versus higher council spending on homelessness (pounds per resident household)
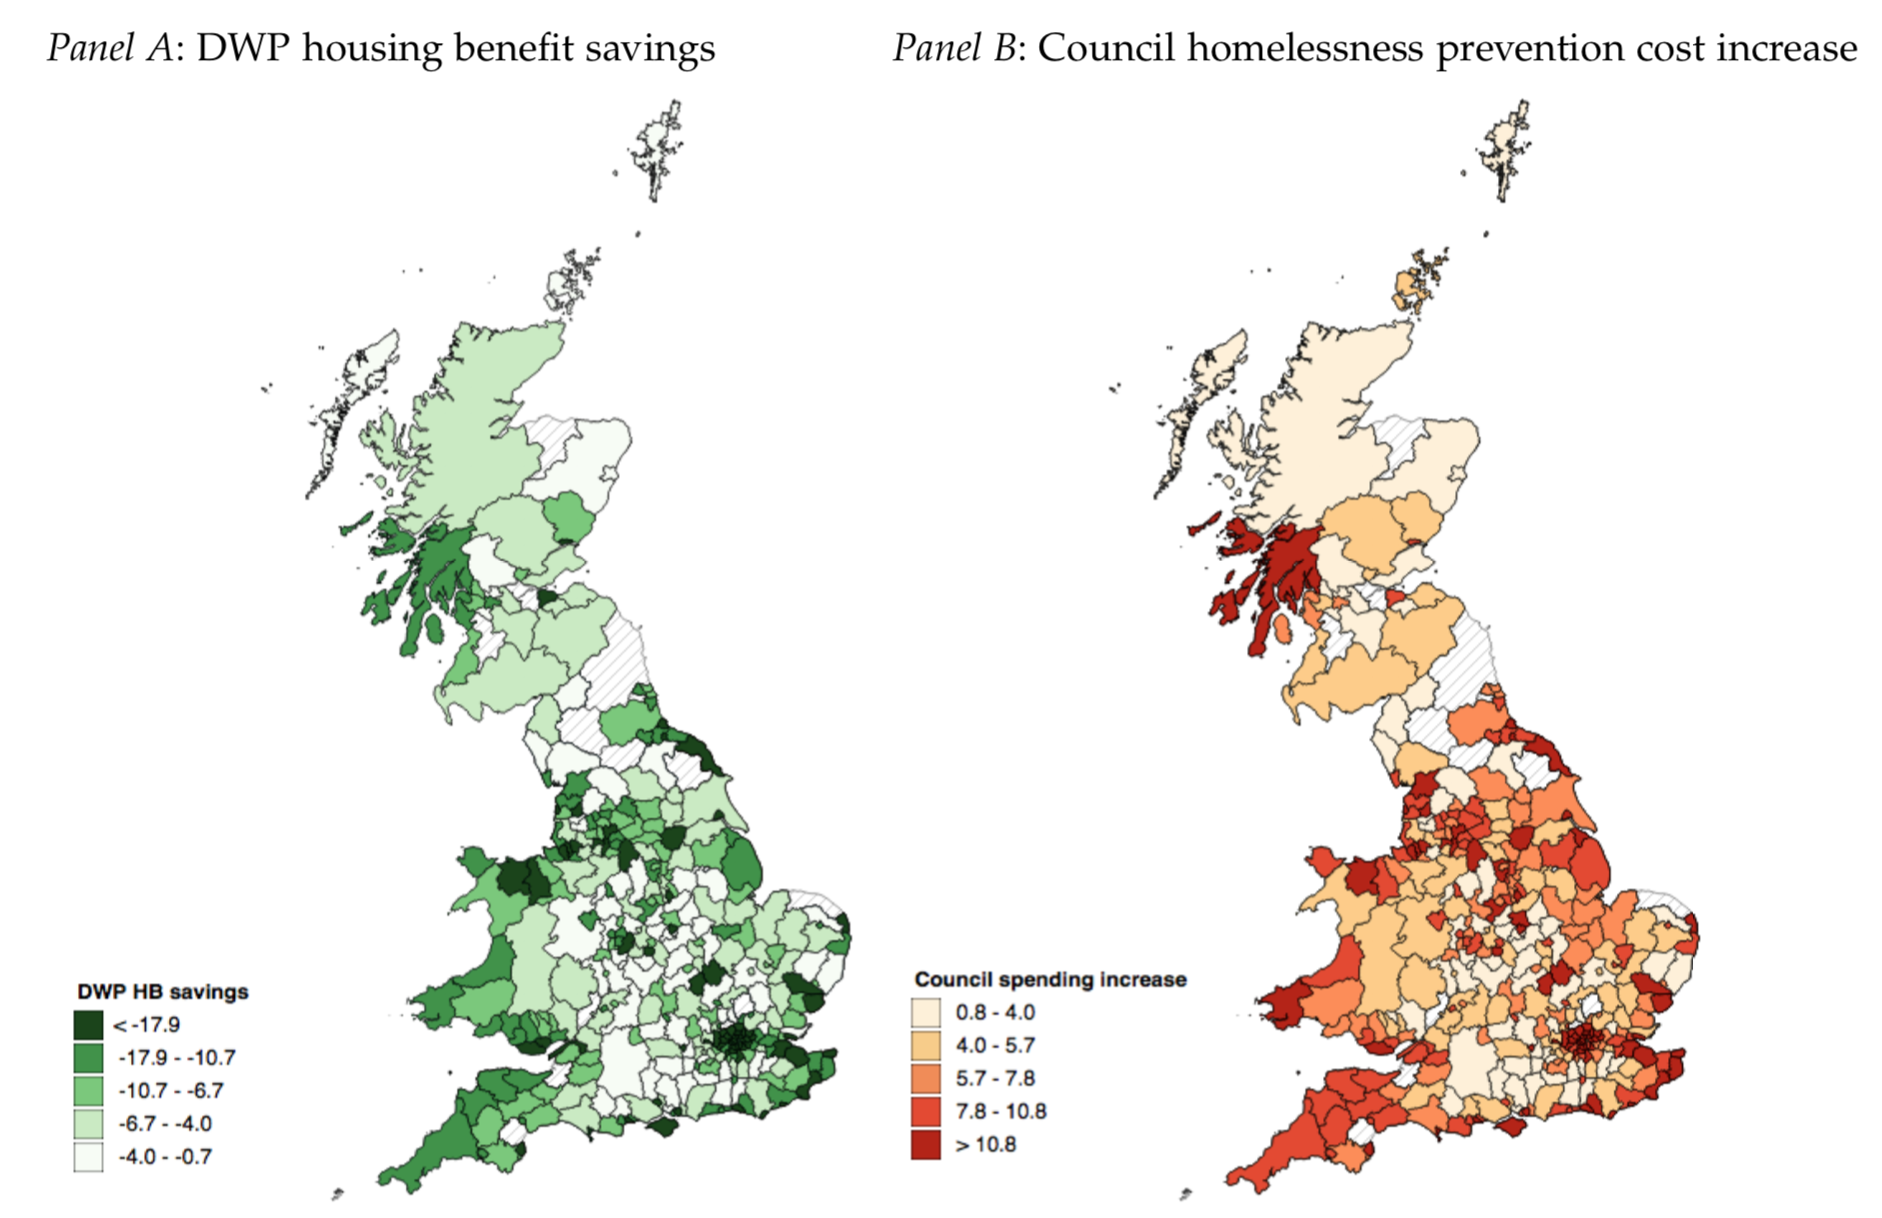
Our calculations denote that in the case of the median (mean) council, for every £1 saved in lowering spending on housing benefit, 75p (53p) is spent on preventing homelessness or on housing individuals at risk of becoming homeless in temporary accommodation. The further indirect social and economic costs due to the potential adverse effects on outcomes, especially for children brought up in insecure conditions, likely weigh in even further.

Concluding remarks

Cutting housing subsidies, while appearing to be fiscally attractive, may result in significant economic and social costs. Insecure housing and forced displacement – which, as we show, can directly result from cuts to housing assistance – may result in further social costs such as negative consequences for health (Fowler et al. 2015) or labour markets (Van Dyk 2019), and may also have adverse effects on children’s educational attainment (Humphries et al. 2019, Chyn 2018). We also show that insecure housing may erode democratic participation, increasing concerns over political legitimacy. In that sense, our work contributes to a growing literature that examines the role that housing plays in shaping contemporary political preferences (Ansell 2014, 2019, Adler and Ansell 2020), and in particular the role that welfare cuts may play in shaping political outcomes (Fetzer 2019).

Wednesday, 1 January 2020

Food banks - good article for evaluation in your current Micro topic

In his introduction to Labour’s election manifesto, Jeremy Corbyn pledged to end something he called “food bank Britain”, and when I read that my immediate thought was: “I hope he never does.” This is not because I take any delight in the idea that thousands of my fellow citizens regularly go to local food banks to get food to feed themselves and their families, but rather because of the deeper significance of food banks; what the fact of their existence actually tells us about this country and its people. Our network of food banks should be a cause for national pride, not shame; food bank Britain is not a symptom of decline or national hard-heartedness: it shows us as our best. Let me explain.
Ten years or so ago I got involved in setting up a food bank in Oxford. It was a bit different from most food banks because, rather than receive food donations from the public to give to families in need, it set out to be a “food recovery” operation. We asked supermarkets and wholesalers to give us their surplus fresh food (bread left over at the end of the day, wilting vegetables, that sort of thing) which we then gave to other charities operating in the city. The idea quickly took off and today the organisation is a well-established part of the city’s charity landscape. My involvement taught me many lessons: about the colossal (and shameful) amount of food that is wasted daily across the country but also that voluntary action, at a local level, is a good in and of itself. To paraphrase Shakespeare on mercy: the quality of food banks is twice blessed. It blesseth him that gives and him that takes.
In the Book of Revelation it is promised that eventually God will “wipe away every tear” and it is a long-standing fantasy of the British Left that our welfare state should emulate this feat. But there are practical reasons why this will never happen and what’s more, why it should not.
One of the surprising things I learnt from my food bank experience was the appetite there is for volunteering: it was never a problem to get volunteers to drive our vans and hump around sacks of potatoes. On the contrary we often had to put volunteers on a waiting list. It’s easy to sneer at ‘do-gooders’ (and some on the Left make a speciality of it) but the instinct that drives people to offer their labour free of charge is surely a good thing. It means that individuals make a personal investment in their local community — and these are the ties which bind. A well-stocked, well-run food bank is a sign of a healthy community.
SUGGESTED READING
Don't call it poverty porn
BY JENNY MCCARTNEY
I am pretty sure that when Mr Corbyn wrote about ending food bank Britain he was not aiming his guns at local volunteer groups; what he meant, I think, was that the benefits system should be generous enough to ensure that no one need access a food bank ever again. But there are good reasons to believe that, however munificent the social security payments were, we would never arrive at that happy destination. However hard we try there are always going to be some people in poverty; a combination of bad luck and bad individual choices will ensure it is so. Our benefits system is designed to provide a basic standard of living but despite its good intentions there are always going to be circumstances in which people don’t get what they need. It is an intractable failing of a huge bureaucratic mechanism.
Food banks are a relatively new phenomenon. They burst into the national consciousness in a major way some time in the noughties and the reason they did was largely through the efforts of a charity, The Trussell Trust, which now operates about 1,200 centres across the country.
Because the work of food banks is so practical — there is, after all, no charitable action more basic and fundamental than giving food to the poor — their appeal was immediate; kind and well-intentioned people saw food banks as a straightforward vehicle for their generosity. New food banks sprang up everywhere and because they were newcomers to the charity scene — the Trussell Trust only got going in 1997 — they attracted a lot of media attention.
SUGGESTED READING
How charities are corrupted by Whitehall
BY IAN BIRRELL
Much of that media coverage was misleading. The rise in the number of food banks was used to argue that ‘food poverty’ was on the rise, but that was faulty logic. Commentators and politicians said: “Look at the facts. Last year another x hundred food banks opened round the country. That proves our point.” Actually the rate at which new food banks were opening was unrelated to the underlying real rate of poverty. What the statistics demonstrated was that the food bank movement had caught the public imagination; people saw them as a way of helping others in the most practical way possible. The food banks were offering a new and useful service to people on very low incomes who flocked to them. Why wouldn’t they? If you are on a very tight budget a local food bank can ease the pressure. But, inevitably, food banks got dragooned into the political debate.
The food bank argument is now a permanent fixture in the Left’s political rhetoric. In the run-up to the election The Independent carried a story about a Tory candidate (and now MP), Darren Henry, who at a public meeting was incautious enough to offer the opinion that people who use food banks are often those who can’t manage their budgets properly. Predictably his comments were condemned by his opponents and, as the paper said, “drew gasps from the audience”.
He may well be right but he would have been better advised to keep his thoughts to himself; this is an argument the Right can never win. The Independent article, in typically tendentious fashion, observed: “The proliferation of food banks, which were rare before the 2008 financial crash, has increased hugely under the Conservative government, with many experts and campaigners blaming austerity and policies such as universal credit for driving the surge in need.” This is a perfect example of how the truth gets mangled in the poverty debate.
SUGGESTED READING
Why money won't fix the poverty problem
BY ANDY COOK
Yes, it is true that food banks were uncommon in the early years of the new millennium; that’s because the movement was only just getting going. And then came the financial crash and reporters had to find a way of illustrating their stories. What better way than to highlight the growing numbers of food banks? The coverage acted as promotional videos for the food bank movement; it touched the generous instincts of the country and lo! food banks sprang up everywhere. What gets overlooked is that, had food banks been operating 30, 40 or 50 years ago they would have been just as well patronised — but then no one had thought of them.
None of this debate should obscure a fundamental truth: it is good to feed the poor. The Church has always seen it as one of the “corporal works of mercy”, that is those actions which attend to basic human necessity. It’ll be a black day when Britain fails to rise to the challenge of poverty and, despite the wonders of our welfare state, there will always be the need for that to be supplemented by the efforts of individuals.
I would go further: it is neither possible, nor desirable, that the state should displace and render unnecessary all voluntary charitable action. Across the country millions of people volunteer their time and effort to help make life a little better for others. Both sides gain from this arrangement and government is well advised to let the volunteers get on with it.
While the state should never lose sight of its obligations to the poor food banks should make us proud, not ashamed.

Thursday, 23 May 2019

If you want to know how an economist looks at an issue...

Read this scathing attack on the UN report on poverty in the UK. The first part of the article pulls apart the politics in the report, but the second part looks at the issue of poverty, and why this report does nothing to alleviate it:

Amber Rudd is right to complain about the UN’s shrill, partisan report

It might seem to some observers that the department of work and pensions has been tasked with designing a digital and sanitised version of the 19th-century workhouse.
So reads the final report on the UK from the UN special rapporteur on extreme poverty, Philip Alston.
The Australian human rights lawyer spent fully 11 days in this country before writing a damning indictment on government welfare policy since 2010.
So incensed is HM government by his findings that Amber Rudd, the Work and Pensions Secretary, has decided to file a complaint to the UN. Equally predictably, a chorus of Labour MPs and lefty keyboard warriors aver that this is yet more evidence of the Evil Tories’ anti-poor agenda.
What’s most striking about the report is not the findings themselves, but the shrill, partisan tone adopted by Alston throughout. That Alston’s intention is to launch a political attack looks clear when he ventures off piste to attack policies such as privatisation of the utilities, which have at best a tangential connection to the welfare system.
Alston is entitled to make points about spending priorities and their effects, but his penchant for glib moralising wears thin very quickly, even in a report that numbers only 21 pages.
For example, he accuses the government of a “punitive, mean-spirited and often callous approach” and an “uncaring ethos”. He claims cuts to welfare spending were born out of a “commitment to achieving radical social re-engineering”.
There is scarcely a mention of the massive financial crisis and recession which preceded the Coalition government coming to power, or any kind of analysis of the fiscal backdrop ministers have operated in since.
What, too, are we to make of his contention that ministers have been stripping back the welfare state despite a “booming” economy? Employment may have held up remarkably well, but pretty much everyone agrees that both GDP and wage growth have been anaemic at best for many years.
The rationale behind policies is not really on Alston’s agenda though. In his analysis it’s not just that they are misguided or poorly implemented, but that the people in charge are morally defective. Is he really all that surprised when the same ministers he excoriates are not all that inclined to engage with him?
By far the biggest issue though, and one which is barely mentioned in the report, is the way social security spending is tilted towards older people. The regular debate over whether pensioners should get free TV licences or bus passes obscures the much more costly policy of retaining the triple-lock on the state pension (which Alston calls ‘commendable’). Over-65s in work, some on very high salaries, are also helped out by not having to pay national insurance, which is  manifestly unfair given it is now just another form of income tax, rather than a proper contributory system.
Sadly in Alston’s report this kind of policy discussion too often plays second fiddle to coming up with sassy comments about what blackguards the government are. The ‘workhouse’ comment is a case in point – the welfare debate’s equivalent of Godwin’s Law. In much the same way as many people feel compelled to needlessly mention the Nazis in any discussion, some on the left feel an argument about poverty is incomplete without claiming we’ve somehow gone back to the 19th century.
Never mind, though, as it’s a pitch perfect soundbite for the one-line news generation, and the line many news outlets have understandably chosen to lead on.
More problematic than this kind of hyperbolic guff, though, is Alston’s approach to statistics. For instance, we hear that 14 million Britons are living in poverty, with little discussion of the metric used to arrive at that figure.
As we’ve discussed before on CapX, the most frequently used method at the moment puts a household in ‘relative poverty’ if its income is 60 per cent of the median national income. At the moment, that gives you a figure of about £16,000.
Whether or not that puts a household into poverty clearly depends on a range of factors, not least the hugely variable cost of housing in different parts of the country.  Equally, for those pensioners who have already paid off their mortgage, £16,000 a year may not be an extravagant amount, but nor does it necessarily mean they are on the breadline. The same amount in Wigan will obviously go a lot further than in inner London.
There is a much more basic problem though. The “relative poverty” figure Alston cites is not a measure of poverty, but of inequality – an important metric with serious consequences, but by no means the same thing as poverty. After all, there’s a gigantic degree of inequality between pretty much everyone on earth and Bill Gates, that doesn’t make all the rest of us poor.
What makes it a particularly bad metric is that relative poverty declines if the better off get poorer, even if the poor have seen no improvement in their own living standards. That’s often the case during a recession when everyone’s incomes take a hit – inequality might fall, but no one is doing any better as a result.
Raising such quibbles inevitably leaves one open to being insensitive to the problems facing those at the bottom of the income ladder. However, asking for precision in statistics is not the same thing as airily dismissing the fact that many people face grave difficulties. If anything, it is demanding a more accurate appraisal so that the very neediest can get the support they need.
In fairness, as well as the overblown ’14 million in poverty’ number, Alston does offer a separate figure of 1.5 million people who have “experienced destitution”, which is defined as going without basic needs such as food, clothing, toiletries or fuel. This too might have its pitfalls, but is clearly closer to what most of us would think of as poverty than the relative measure discussed above.
It’s a far smaller number of people than the 14 million supposedly in poverty, and It also points to a far more severe level of hardship. The Joseph Rowntree Foundation, for instance, has a definition of destitution that includes a single person having under £70 a week in income, less than a quarter of the household rate in the ‘relative poverty’ measure.
The fact people are living in such penury in a wealthy country should prick all of our consciences. At the same time, it’s not unreasonable to point out the difference between inequality and outright poverty.
That kind of precise, clear-sighted view of what’s really going on in the UK is what ministers ought to be debating and acting on. Strident, biased and obviously partisan rhetorical attacks, such as those offered by Philip Alston, are altogether less useful.

Wednesday, 22 May 2019

A look at the UN Poverty Report on the UK


Although this chap is sometimes hard to follow, there are at least two standout items in here: first, data can be manipulated merely by using different standards (e.g. RPI vs CPI); second, is the GDP data capturing real economic growth?


The UK poverty problem is more than a story about austerity


Timing can sometimes be if not everything very important and so the release of the UN report on UK poverty by Phillip Alston on the day we get the latest data on the public finances is unlikely to be a coincidence. So let us get straight to it.
Although the United Kingdom is the world’s fifth largest economy, one fifth of its population (14 million people) live in poverty, and 1.5 million of them experienced destitution in 2017.
That is certainly eye-catching especially the use of the word destitution. However it was only on Monday that Andrew Baldwin reminded us that using purchasing power parity or PPP the UK is in fact the ninth largest economy rather than the fifth. So we note immediately that many of these concepts are more elusive than you might think. That issue particularly relates to the issue of poverty which is basic terms can be absolute or relative. With the relative definition we find that people can be better off but poverty gets worse. especially if the definitions are changed. I note that the Social Metrics Commission has done exactly that.
This new metric accounts for the negative impact on people’s weekly income of inescapable costs such as childcare and the impact that disability has on people’s needs……. The Commission’s metric also takes the first steps to including groups of people previously omitted from poverty statistics, like those living on the streets and those in overcrowded housing.
The issue is complex and on a personal level my eyes went to one of the supporters of this which is the same Oliver Wyman which assured us that Anglo Irish Bank was the best bank in the world in 2006.  It was not too long before it was nationalised and made the largest loss in Irish corporate history.
The Detail
Be that as it may the report tells us this.
 Four million of those are more than 50 per cent below the poverty line and 1.5 million experienced destitution in 2017, unable to afford basic essentials. Following drastic changes in government economic policy beginning in 2010, the two preceding decades of progress in tackling child and pensioner poverty have begun to unravel and poverty is again on the rise. Relative child poverty rates are expected to increase by 7 per cent between 2015 and 2021 and overall child poverty rates to reach close to 40 per cent.
On the other hand if we go to the absolute poverty measure then we are told this.
“There are 1 million fewer people in absolute poverty today – a record low; 300,000 fewer children in absolute poverty – a record low; and 637,000 fewer children living in workless households – a record low.” ( Prime Minister May)
As you can see there is an extraordinary difference between the two approaches.
UK Public Finances
We can look at the situation from this perspective so here we go.
Borrowing (public sector net borrowing excluding public sector banks) in April 2019 was £5.8 billion, £0.03 billion less than in April 2018; the lowest April borrowing since 2007.
 So the monthly numbers were better albeit by the thinnest of margins so let us delve more deeply.

Borrowing in the latest full financial year (April 2018 to March 2019) was £23.5 billion, £18.3 billion less than in the previous financial year; the lowest full financial year borrowing for 17 years (April 2001 to March 2002).
As you can see we are now approaching a possible budget balance because the same rate of improvement this year would pretty much wipe the deficit out. This raises a wry smile because when the government was supposedly trying to do this it remained a mirage and was always around three years away on the forecasts. Except three years later it was three years away again! Yet the current government has regularly promised to end austerity and has in fact made quite a lot of progress towards a balance budget. Make of that what you will. In fact the situation has levels of complexity as the spending numbers make clear.
Over the same period, central government spent £740.7 billion, an increase of 2.5%.
Those are the numbers for the full financial year to March and they open the austerity debate again. It depends which inflation measure you use as to whether that is a cut in real terms (RPI) or a rise ( CPI). It also depends on how you define austerity as that too varies. Monthly numbers vary but the latest month suggests a minor reduction in it.
 while total central government expenditure increased by £1.8 billion (or 2.7%) to £66.5 billion.
Moving onto what has changed the deficit numbers ( what used to be called the PSBR) the most has been this development.
In the latest full financial year (April 2018 to March 2019), central government received £739.7 billion in income, including £559.0 billion in taxes. This was 4.9% more than in the previous financial year.
As you can see revenue has been strong and that gives us a hint that maybe the economy has been stronger than the GDP data has picked up and perhaps more in line with the employment and real wages numbers. One way of looking at the situation is to compare revenue with the national debt and if we do so using the international standard ( Maastricht) then it is 40%.
Whilst we are looking at revenue I am often critical of Royal Bank of Scotland so let me also post the other side of it.
On 14 February 2019, The Royal Bank of Scotland Group plc (RBS)announced the dividend price to be paid to shareholders on 30 April 2019. As a shareholder, the government received £0.8 billion
Comment
The report from the UN’s special rapporteur does remind us of problems as well as teaching me that the word rapporteur exists. Those familiar with my work will know that the fact that real wages are still nowhere near the previous peak is an issue. Added to this comes the enormous effort to keep house prices out of the inflation index and then the way that the costs of home ownership are represented by fantasy rents which are never paid. You might reasonably argue that home ownership is the distance of Jupiter away for the poor but the mess made of this area has affected even them as via problems with the balance between new and old rents it seems likely to me that the official rental data has recorded the wrong numbers as in too low.
Whilst the good professor has sadly resorted to a bit of politicking I thing he is on form ground pointing out issues like this.
Children are showing up at school with empty stomachs, and schools are collecting food and sending it home because teachers know their students will otherwise go hungry…….In England, homelessness rose 60 per cent between 2011 and 2017 and rough sleeping rose 165 per cent from 2010 to 2018……. Food bank use increased almost fourfold between 2012–2013 and 2017–2018,29 and there are now over 2,000 food banks in the United Kingdom, up from just 29 at the height of the financial crisis.
The rough sleeping issue has increased in the area I live ( Battersea). I also agree that Universal Credit was a good idea that has been implemented incompetently.

Thursday, 28 June 2018

Is "Relative Poverty" a valid analysis point?

The UN's Absurd Measure of US Poverty

  • poverty_0.JPG


06/26/2018

The United Nations is at it again with yet another report on how bad poverty is in the United States — and how things would improve greatly if the US raised taxes. This time, the UN denunciation of the US has raised the ire of US ambassador Nikki Haley who has called the report "patently ridiculous."

Specifically, Haley was responding to a June 18 report by UN bureaucrat Philip Alston. Alston concluded that poverty rates in the US are among the worst in North America or Europe.
How did Alston come to this conclusion?

Well, first of all, it's important to note that he didn't collect any new information.
The report comes at the end of a two-week visit to the United States conducted back in December of 2017. At the time, Alston released a similar preliminary report.

The new report to the UN Human Rights Council is just an update of the old report.
Moreover, Alston could have easily authored the report had he just stayed home. The report is based simply on existing data already collected and published by agencies such as the US Census Bureau and the OECD. Any undergraduate could have written a similar report using data he found online.
One example of this method is found in Alston's reporting on poverty.

According to the report:
About 20 per cent of children live in relative income poverty [in the United States], compared to the OECD average of 13 per cent.
Here, Alston has essentially cut and pasted text from an existing OECD report. There's nothing wrong with this, per se, except for the fact that Alston has implied he has recently completed a thorough survey of poverty in the United States — even though he clearly hasn't.

This November 2017 report from the OECD reads:
[C]hild relative income poverty rates are very high – around 20% of children in the U.S. live in relative income poverty, compared to just over 13%, on average across OECD countries.
The report also includes this graph:
Jun-23-18-OECD-Child-Poverty-Fraud_0.jpg
But there's a problem here with Alston's use of the data. The OECD report refers to "relative income poverty," which isn't what most people think it is. Most people would think a poverty rate should measure incomes against the cost of maintaining a certain basic living standard. But this "relative" poverty measure isn't that sort of measure. It's just a measure of how many people in a country make 50% or more of that country's median income level.

So, if you have country with a very low median income, and a very low standard of living, it's possible to have very low poverty rates — so long as most people make more than fifty percent of that country's lousy median income level.

This allows the OECD to claim — as it does in the graph — that the US has higher poverty rates than Mexico.

In order to understand this more fully, let's look at the OECD's own measure of disposable median income for each of its member countries (2015 data) in Graph A:
_median_income.png
These numbers include both ordinary wage income and also cash assistance from welfare programs. It is also adjusted for local purchasing power and rendered in international dollars.

Now, note in the footnote of the OECD graph above that you're poor — regardless of where you are — if you make 50 percent of the local median income. So, 50 percent of the median income in Greece (with a median income of $13,000) or 50 percent of the median income in Norway (with a median income of $39,000) are both simply "poverty."

But let's look at just how huge these differences can be.  If we look at incomes at the 50 percent level for each country, we get in Graph B:
50_percent_poverty_rate.png
If you're going to be poor by this measure, you'll have a higher income in the US than in many other places. For example, the poor in the US at the median poverty level have incomes 34 percent higher than the median poor in Italy. When comparing the US and Spain, the US comes in at 40 percent higher.

Put yet another way, if you make $15,000 in the US, you're poor. But if you make $15,000 in France, Germany, the UK, or Italy, you're not poor. Why? Because the overall median incomes in those non-US countries are lower.

Basically, by this measure, poverty has little to do with what resources you have at your disposal. It's more or a measure of how much you're making compared to how much other people are making. It's a measure of income inequality, not poverty.

The problem with making comparisons this ways can also be illustrated by looking at the US poverty-level income compared to the median income from other countries. For example, the US poverty-level income is so high it's at 70 percent of the median income in Spain and 67 percent of the median income in Italy in Graph C:
poverty_ratio.png
If you have a median poverty-level income in the United States, your income is 95 percent the size of the median income of all households in Portugal. Stated broadly, we might say that poor households in the US have pretty much the same income as the overall population in Portugal. Or, one might say the median poverty income level in the US is nearly two-thirds as high as the overall median income of everybody in the United Kingdom.

Clearly, if a poor household in the US has an income 40 percent higher than a poor household in Spain — then these two types of "poverty" are not the same.

Measuring Poverty by Actual Standards of Living

A more honest way to measure poverty would be to look at actual indicators of the standard of living. This would include household amenities, living space, labor-saving appliances, entertainment, and so on.

For example, living space in the US, even among the poor, is measurably more plentiful than elsewhere. As noted by Robert Rector at the Heritage Foundation:
Housing space can also be measured by the number of square feet per person. The Residential Energy Consumption survey conducted by the U.S. Department of Energy shows that Americans have an average of 721 square feet of living space per person. Poor Americans have 439 square feet. Reasonably comparable international square-footage data are provided by the Housing Indicator Program of the United Nations Center for Human Settlements, which surveyed Housing conditions in major cities in 54 different nations. This survey showed the United States to have, by far, the most spacious Housing units, with 50 percent to 100 percent more square footage per capita than city dwellers in other industrialized nations.

America's poor compare favorably with the general population of other nations in square footage of living space. The average poor American has more square footage of living space than does the average person living in London, Paris, Vienna, and Munich. Poor Americans have nearly three times the living space of average urban citizens in middle-income countries such as Mexico and Turkey. Poor American households have seven times more Housing space per person than the general urban population of very-low-income countries such as India and China.
As Rector notes, "There is a vast gap between poverty as understood by the American public and poverty as currently measured by the government." This is due to a wide variety of reasons. One reason is that income surveys don't count non-cash poverty relief programs. This means programs like Medicaid and food stamps aren't included in the incomes of low-income households in America. That makes those incomes looked significantly lower than they are.

Poverty measures also can't take into account heads of household who have low incomes, but also don't have a mortgage because they're paid off their houses already. This is not an insignificant factor in measuring poverty among the elderly.

All of this is important because in Alston's report to the UN, he relies on US government data using the traditional poverty-rate measures. He then combines these with the OECD's "relative" poverty measures to conclude that poverty is "shockingly" widespread in the United States.

A closer look at the data, though, suggests things are more complicated.

None of this is to say that poverty doesn't exist anywhere. Of course is exists, and issues like homelessness and true poverty are real for some people. Sweeping claims like those by Alston tell us very little, however, about the real state of poverty in the US. 

Ryan McMaken (@ryanmcmaken) is the editor of Mises Wire and The Austrian. Send him your article submissions, but read article guidelines first. Ryan has degrees in economics and political science from the University of Colorado, and was the economist for the Colorado Division of Housing from 2009 to 2014. He is the author of Commie Cowboys: The Bourgeoisie and the Nation-State in the Western Genre.