Quote of the day

“I find economics increasingly satisfactory, and I think I am rather good at it.”– John Maynard Keynes
Showing posts with label credit cycle. Show all posts

Sunday, 17 March 2019

Extension Material - connections across different parts of the economy

Great article selling shipping as an investment - note I am not advocating this, just showing you how many different aspects of the global economy come together in one place. This has got some very interesting elements - capital cycle, regulation, market failure, demand and supply, to name just a few.

Sir John Templeton used to quip that “People are always asking me where the outlook is good, but that’s the wrong question… The right question is: Where is the outlook the most miserable? Invest at the point of maximum pessimism.” 

If you want deep value and a wide margin of safety then you have to be willing to venture where others won’t. Maximum pessimism is what creates the asymmetric bets where the risk then becomes time and not price, as Richard Chandler puts it.

Looking across global markets today there is perhaps only one industry that fits this bill. Where the outlook is beyond miserable and the stocks within it have either been dismissed by investors or just outright forgotten all-together. I’m talking about the shipping sector. 

Take a look at the following charts showing the prolonged grinding drop in shipping rates. The Harpex Shipping Index has been in a steep rolling bear market for nearly a decade and a half.


The Baltic Dry Index is down to 645. It’s only been lower three other times in the past 35-years for which we have data. Once in 1985, then in 2015 and again in 2016. 


Price action drives sentiment which in turn drives price action in a perpetual feedback loop. A decade plus of falling prices and negative investment returns has created a pretty fatalistic consensus towards the industry — which has, in turn, led to some pretty amazing prices… 

Many shipping stocks now trade for less than half their liquidation value. And that’s using sale prices in the fairly active second hand purchase market.

This means that companies could liquidate their fleets and after paying off debt there’d be enough leftover cash that equity holders would more than double their money.

So to sum things up, we have (1) maximum pessimism which has driven (2) bargain prices which creates (3) a large margin of safety.

That’s pretty good, but now we need a catalyst.

The shipping industry is a notoriously cyclical industry which follows the classic Capital Cycle . Martin Stopford’s excellent book, “Maritime Economics”, notes that there’s been 23 shipping cycles going all the way back to 1743. Timing here is key. We don’t want to sit in a dead money trade for another 5-years when our capital could be going towards something that’s actually working for us.

Luckily, there’s a number of potential catalysts lining up that could make 2019 the year that the trend finally changes. These are:

  • A one-two regulatory punch
  • New banking regs leading to tighter financing and thus lower supply
  • Capital Cycle: supply and demand in deficit
  • China/India starting to buckle down on fighting pollution which means they need to import cleaner industrial fuel imports (ie, more shipping demand)
Let’s start with the one-two regulatory punch.

Last year shipping companies were forced to begin installing costly ballast-water treatment systems, thus raising the operating costs on an already struggling industry. And by next year, shippers will have to adhere to IMO 2020.

IMO 2020 is a new global regulation aimed at reducing airborne sulfur pollution by requiring shippers to reduce the sulphur limits in their fuel from 3.5% to 0.5%. There’s a number of ways for companies to reduce their sulphur output and all of them are bullish for the shipping industries’ supply and demand dynamics.

For instance, shipping companies can install scrubbers that will reduce the sulphur from burning bunker fuel. But, these scrubbers are expensive, which means less capital to deploy towards ordering new ships and paying down debt. Also, installation will require significant dock time which means there’ll be less ships on the water, which means a tighter supply market.

Another option, and this is likely to be the more popular one, at least initially, is for shippers to switch to low-sulfur marine gasoil.

But the issue here is that even with no change to the current pricing conditions, switching to marine gasoil will represent a substantial increase in fuel costs and fuel costs already make up the largest portion of a shipper’s operating costs.

According to Wood Mackenzie, shipping industry fuel costs could increase by $60bn next year. This would represent a jump in fuel expenses of around 50%.

In order to economize on fuel costs, ship charterers are likely to begin slow-steaming ships. Here’s the following on what this will mean from S&P Global Platts (emphasis by me): 

The simplest way to curtail costs would be to reduce consumption via reducing speed.

"Reducing speed from 12 knots to 10 knots would effectively remove 17% of dry bulk shipping supply overnight," it said.

Ships older than 15 years of age, comprising about 142 million dwt or 17% of the existing fleet would come under maximum pressure and would become ideal candidates for scrapping, as their older engines are not able to burn LSFO.

"In 2020, you are going to have a supply shock either through slow steaming of the entire fleet or a combination of scrapping of some of the older ships and the balance of the existing fleet slow steaming," it said.

Then we have new banking regs.

Basel IV bank regulations mean that the traditional sources of financing for the shipping industry (ie, the credit they use to order more ships) are no longer available.

Under Basel IV, bank’s have to account for the volatility of the asset being loaned against. And, well, shipping is pretty volatile. This means that shipping loans are becoming more capital intensive. Gone are the days of 90%+ loan-to-value construction finance which led to the glut of yore. Now, many new vessel orders require over 30% in equity financing.

European banks, which have long been the primary lenders to the industry for the last 100-years or so, are either drastically reducing their loan books or exiting shipping finance all together.

Bear markets are always the authors of bulls. And it’s for reasons like the above as to why tight financing effectively means tight future supply and tight future supply means higher prices.

And this brings us to our next catalyst: The Capital Cycle.

Dry bulk shipping is an extremely capital-intensive business. With over 10,000 ships, each with an average 25-year lifespan, somewhere between 300-500 new vessels need to be built each year just to counteract natural attrition. That’s not even accounting for growth in demand.

According to Clarksons Research, the global bulk fleet is expected to grow by just 2.2% this year.


This will make 2019 the third consecutive year in which demand growth outpaced the growth in supply, putting the market in deficit. 


And by the looks of the current orderbook, this deficit looks set to continue. The current orderbook at just 11% of the fleet, is at its lowest levels since the early 2000s. It takes approximately 2-years from the time of order for a ship to be delivered. So this means that a supply constrained market is practically guaranteed going forward. 


And lastly, we have the growing importance of combating pollution in emerging markets. 

Following China’s recent “Two Sessions”, Li Ganjie, the Minister of Environment and Ecology, declared that “It is necessary to maintain the strength of ecological and environmental protection” and there must be “no wavering, no relaxing” according to Trivium China. Li went on to say that four sources account for over 90% of particulates, with industrial emissions and coal burning the two worst offenders.

The industrial emissions are largely attributed to China’s dirty steel mills. These mills use iron ore that has a high sulphur and ash content. Recent changes in policy will require mills to use less pollutive materials going forward. This means that China will have to import “cleaner” industrial fuel sources (ie, iron ore and coal) from far away places, such as Brazil and Australia.

This is important because iron ore and coal account for over half of the global dry bulk trade (29% and 24% respectively). According to shipbroker Banchero Costa, “China remains very much at the centre of the action, estimated to account for 70 percent of global iron ore imports and 41% of the dry-bulk market all-together”.

Just to show you the outsized impact China has on the shipping market, see the chart below showing Chinese iron ore imports (orange line) and the Baltic Dry Index (blue line).


So the requirement for cleaner industrial fuels is a positive. But this chart also reveals the shipping industries’ achilles heel. China.

Where Chinese iron ore imports go, so too will the shipping industry.

And that’s where the near future for shipping stocks becomes less certain. 

I’ve been writing for the last year about how China is slowing down. This slower growth is clearly visible in the data.


And this is putting downward pressure on global trade; hence the recent collapse in the Baltic Dry Index. 


But I’m also expecting China to begin pump priming its economy for the 2021 centenary anniversary of the Communist Party in the second half of this year. 

If that happens, then we should get a buoyed global market combined with a structurally tight shipping industry; one that appears to be rising from the trough of the capital cycle. 

Throw in the secular rising demand from India crossing the Wealth S-curve and brighter days should be ahead for the industry. 

If this ends up being the case then there’ll be oodles of money to be made. Not only do we have bargain bin prices currently but these companies also benefit from high operational gearing. 

Shipping companies have extremely high fixed costs, so even a tiny uptick in charter rates flows directly through to their bottom lines. Plus, any upturn in the cycle will raise the value of the underlying fleets which are trading at depressed values. This kind of operational gearing combined with the currently low stock prices means that some of these shipping companies could earn their entire market cap in a single year once cash flows mean-revert.


This is why bull markets in shipping tend to be incredibly explosive.

Friday, 23 March 2018

US Debt Levels

Not a lot to read, lots of charts; it is useful for you to have some idea of the level of debt across different sectors and in different forms - not too much detail, but some knowledge about certain sectors (e.g. credit card debt). Note the comment about credit cycles leading the business cycle at the end.

This post was published to members of EPB Macro Research on February 24, 2018. For more analysis and to become a member of EPB Macro Researchclick here.

Debt, Debt And More Debt

Earlier this month, the Board of Governors of the Federal Reserve System released the monthly 'consumer credit report' which outlines the total amount of consumer debt, broken down by category.
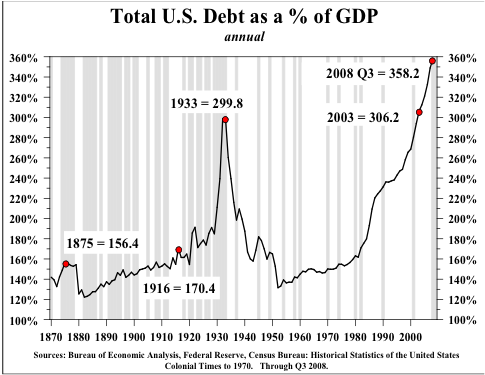
Total Economic Debt to GDP for the United States:
Source: BEA, Federal Reserve, Hoisington, Census Bureau
Note: Today, total debt to GDP is ~ 370%
Debt across nearly every category of consumer loans has reached record levels. Interest rates rising with increased levels of debt translate to higher interest payments and slower consumption growth. At some point, the economy will not be able to handle the current debt load. Debt is the highest level in the country's history as a percentage of GDP.
Total Nonfinancial Debt to GDP for the United States:
Source: BEA, Federal Reserve, Hoisington, Census Bureau
The theory of debt deflation, which I will outline at the end of this piece, has proven correct many times in the past and suggests that this level of debt will result in deleveraging and deflation.
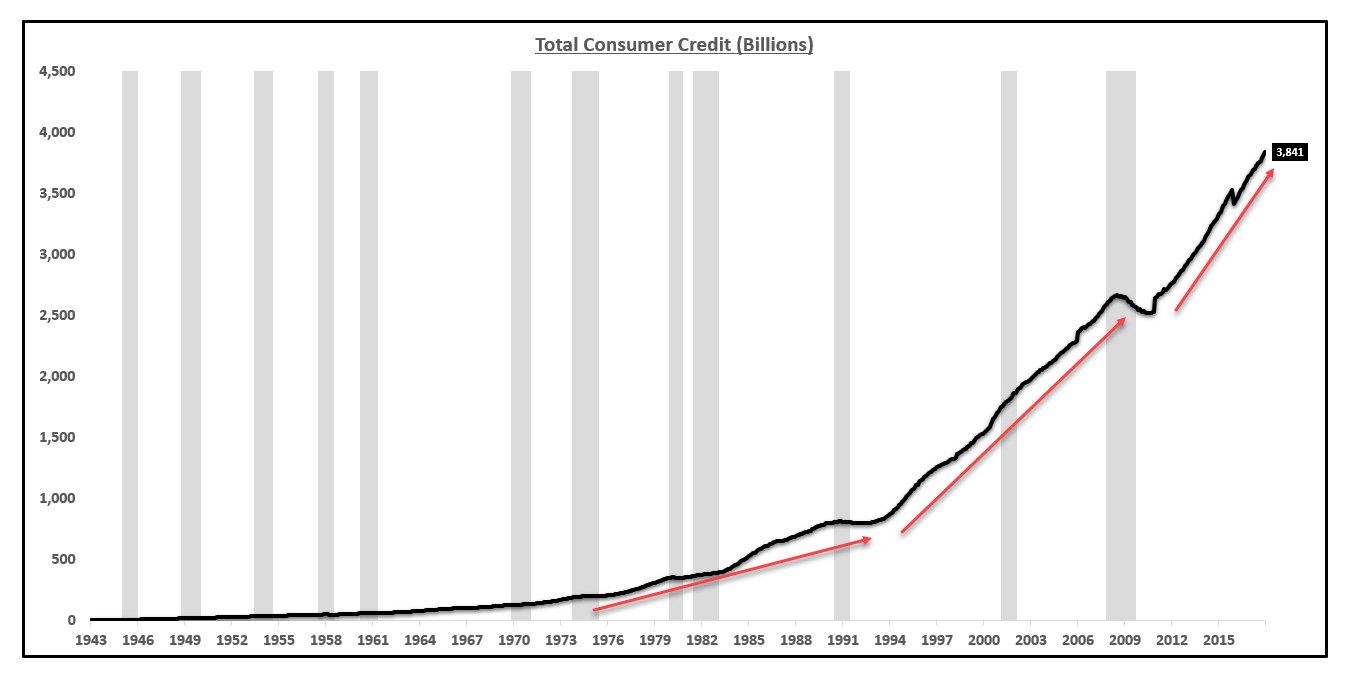
The total level of consumer credit increased to $3.84 trillion which is up 5.4% from one year ago.
Total Consumer Credit (Billions):
Source: Federal Reserve, EPB Macro Research
Not only is credit expanding at a rate that exceeds income growth, the growth in credit is accelerating. The three red lines in the chart above are increasingly steep indicating that credit is rising at an accelerating pace.
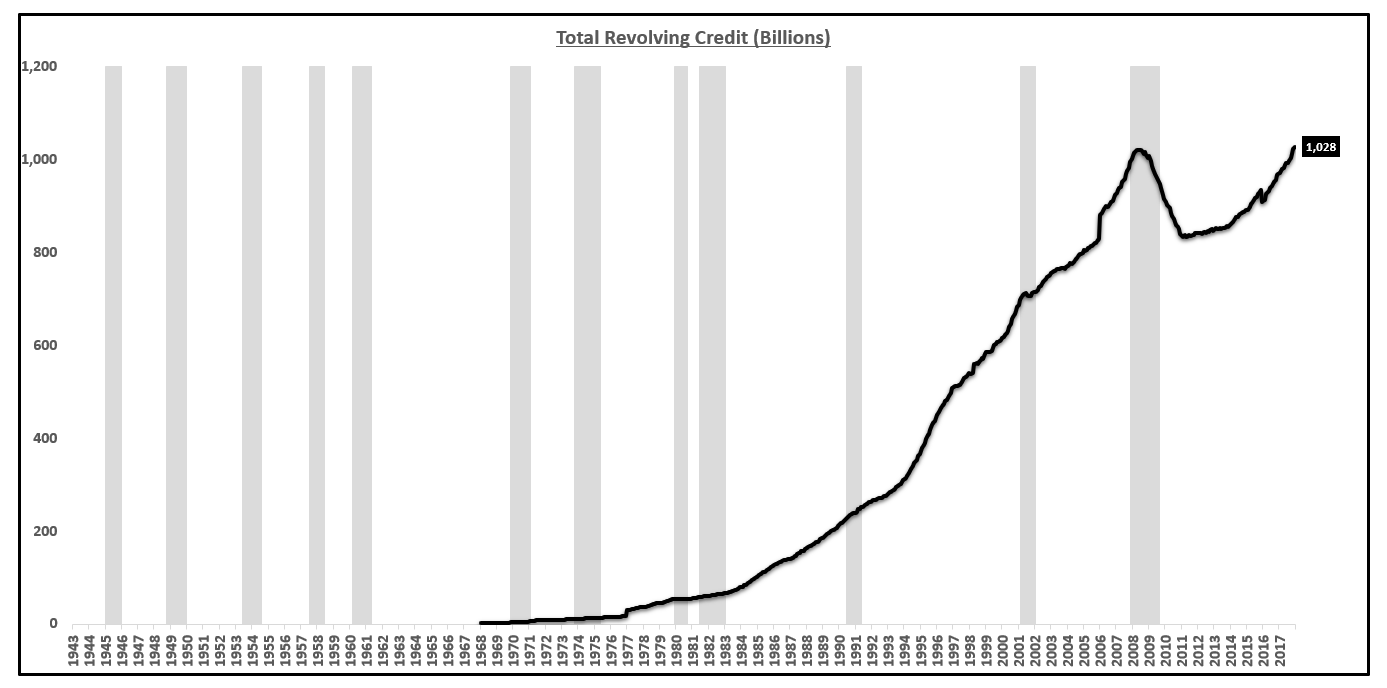
Revolving credit, or more commonly called credit card debt, increased to $1.028 trillion as of this latest report, the highest level recorded, exceeding the 2008 peak.
Total Revolving Credit 'Credit Card Debt' (Billions):
Source: Federal Reserve, EPB Macro Research
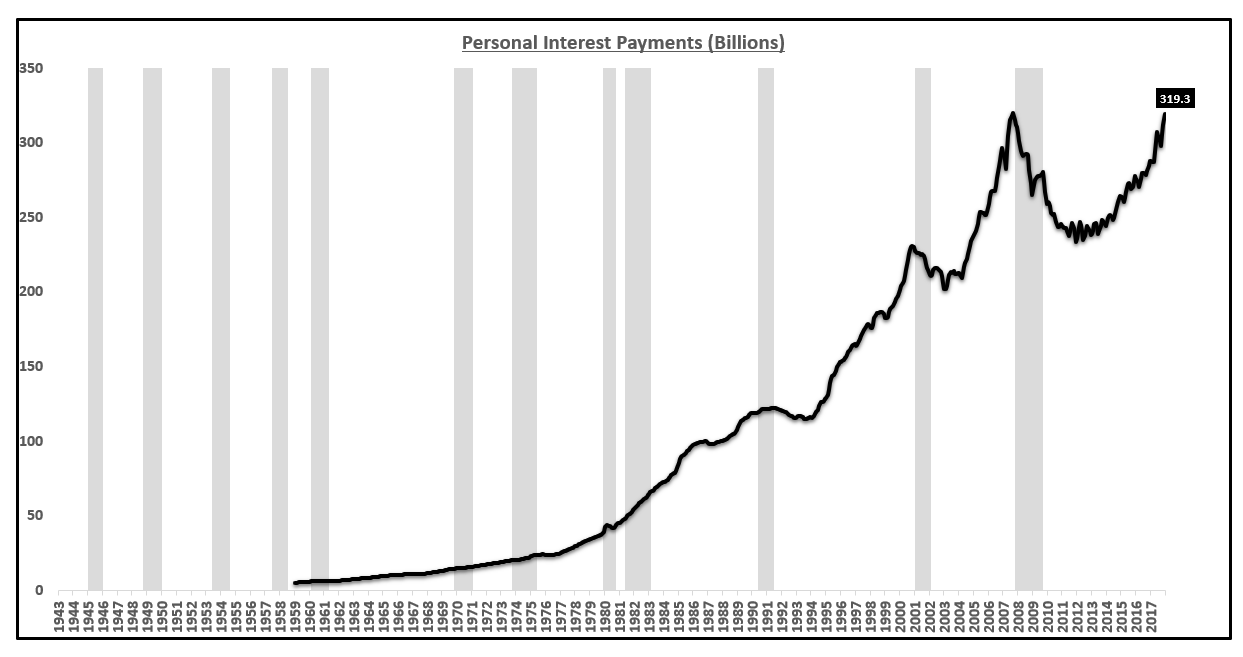
Interest rates have been so low for so long that the consumer has been able to carry a higher nominal debt loan while keeping the interest payments relatively low. The consumer has far more debt today than in 2008 as the charts above show but the total interest payment is roughly equivalent, at $320 billion annually.
Personal Interest Payments (Billions):
Source: Federal Reserve, EPB Macro Research
Interest rates have started to rise across the curve, more notably on the short end of the curve. If interest rates rise at the current debt level, personal interest payments will far exceed that of 2008.
Below, the average interest rate is starting to trend higher on credit cards based on the Federal Reserve report. Higher nominal levels of debt and higher interest rates will mathematically increase interest payments and take a larger share of disposable personal income from the consumer resulting in lower consumption growth.
Average Finance Rate on Consumer Credit Card Loans:
Source: Federal Reserve, EPB Macro Research
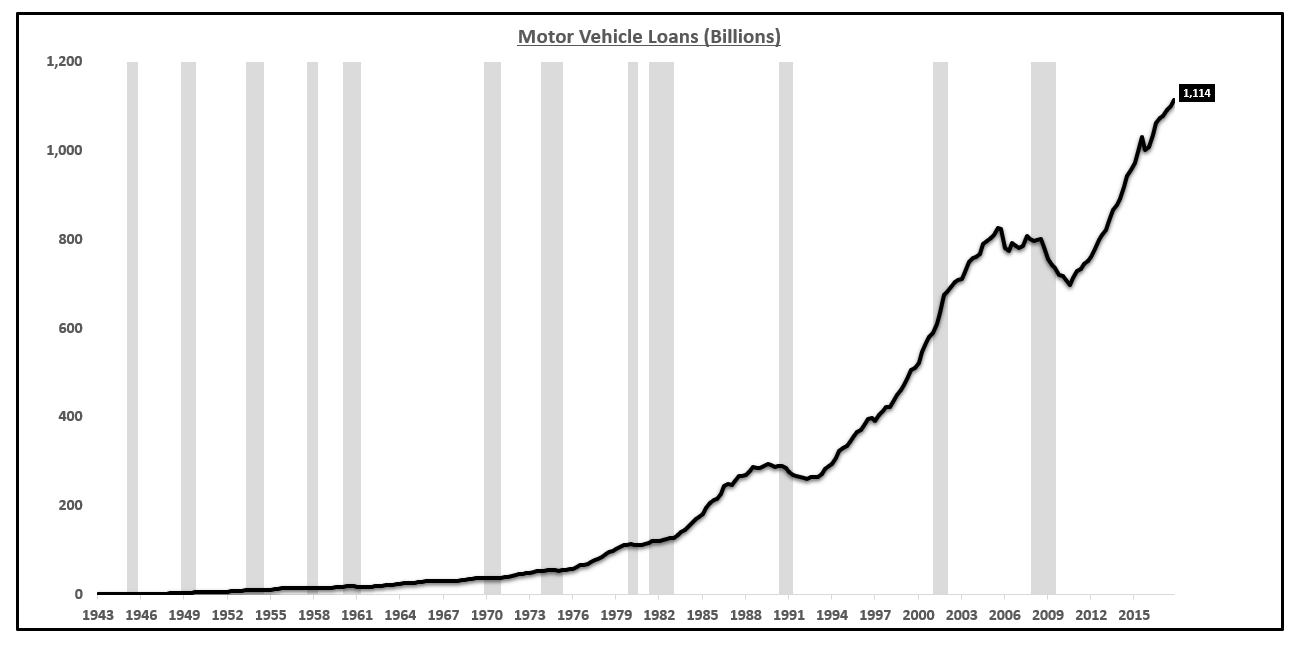
Auto loans have increased to $1.14 trillion, massively above the 2008 peak. Debt soaring across nearly every sector will at some point have adverse effects on the economy, it is a mathematical certainty. Debt pulls forward consumption at the expense of reduced consumption in the future. Credit cannot continue to expand at this pace. A deleveraging will occur.
Auto Loans (Billions):
Source: Federal Reserve, EPB Macro Research
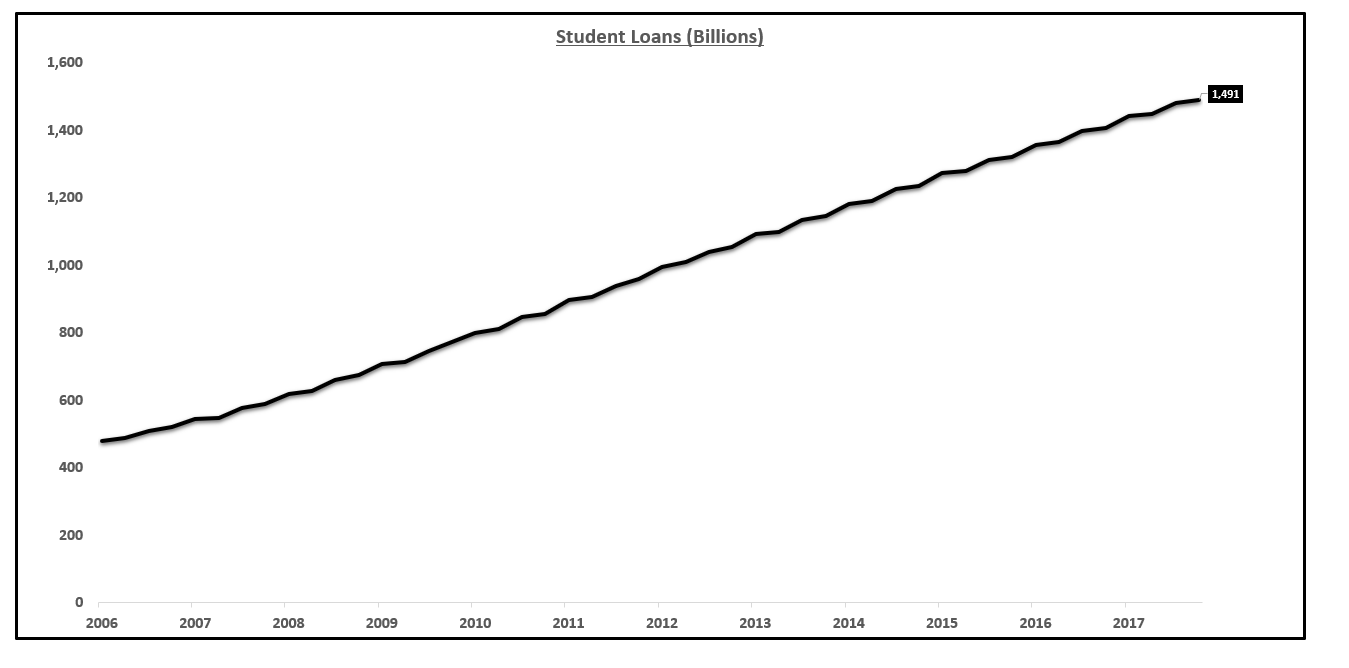
Student loans are the latest category to exceed $1 trillion in outstanding value. The quality of these student loans is notoriously weak which makes this area a very live trigger point during the next economic downturn. Widespread defaults in the student loan space, which seem almost certain to occur due to weak wage growth and rising delinquent balances will cause contain effects.
Student Loans (Billions):
Source: Federal Reserve, EPB Macro Research
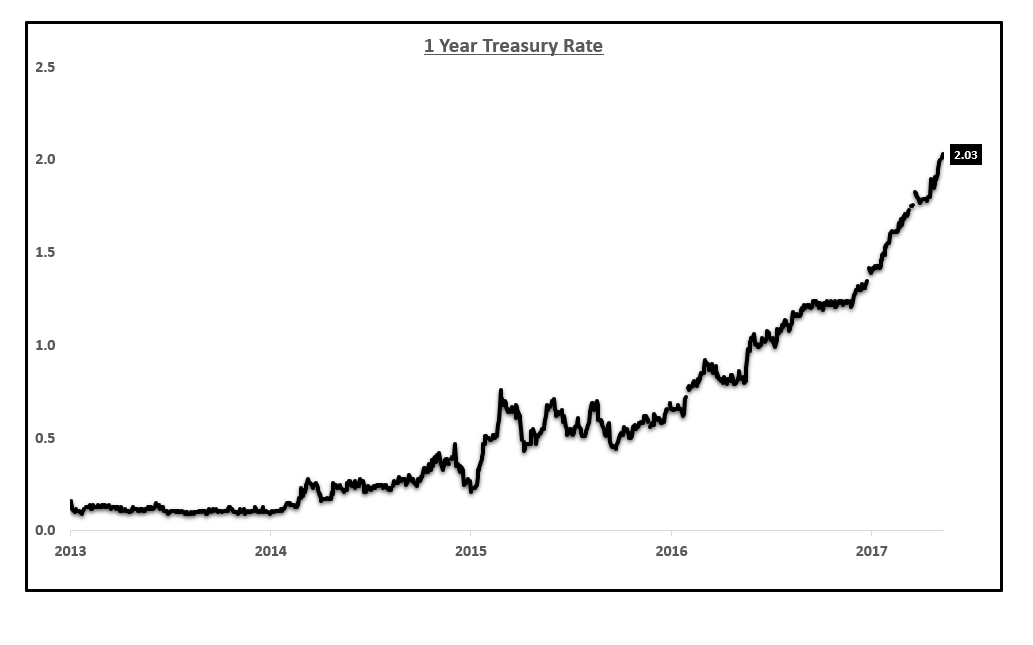
There is no way to predict the day the system finally has too much debt. The trend of higher debt and increasing interest rates poses a very real problem for the economy. The majority of the rise in interest rates has occurred in the past few months.
1 Year Treasury Rate:
Source: YCharts, EPB Macro Research
It will take time for these effects to play out, which is why the current forecast for a sharp economic slow down in 2018, with the strongest slow down occurring in the second half, continues to be a strong thesis with mounting evidence.

The Theory Of Debt Deflation

Debt deflation is a theory that recessions and depressions are due to the overall level of debt rising in real value because of deflation, causing people to default on their consumer loans and mortgages. Bank assets fall because of the defaults and because the value of their collateral falls, leading to a surge in bank insolvencies, a reduction in lending and by extension, a reduction in spending: the credit cycle is the cause of the economic cycle.

Sunday, 18 June 2017

How timely - analysis of credit cycles & turning points

I have stripped out some of the newsletter (the preamble) to allow you to focus on the core "Minsky" point. If you understand this much of the ebb and flow of economies will become much clearer. You can subscribe to this free newsletter here. I cannot believe how lucky you are to cover this point in class, then have the detail fleshed out in an easy-to-read newsletter (again!). I suggest you read the letter from start to finish, re-reading key points to clarify & embed them. This is the shift to A*, and if it happens before the exam, you'll understand why:

The Next Minsky Moment
Economics has its overused themes and phrases, too. One is “Minsky moment,” the point at which excess debt sparks a financial crisis. The late Hyman Minsky said that such moments arise naturally when a long period of stability and complacency eventually leads to the buildup of excess debt and overleveraging. At some point the branch breaks, and gravity takes over. It can happen quickly, too.
Minsky studied under Schumpeter and was clearly influenced by many of the classical economists. But he must be given credit for formalizing what were only suggestions or incomplete ideas and turning them into powerful economic themes. I’ve often felt that Minsky did not get the credit he deserved. I look at some of the piddling ideas that earn Nobel prizes in economics and compare them to the importance of Minsky’s work, and I get an inkling of the political nature of economics prizes.
Minsky’s model of the credit system, which he dubbed the “financial instability hypothesis” (FIH), incorporated many ideas already circulated by John Stuart Mill, Alfred Marshall, Knut Wicksell and Irving Fisher. “A fundamental characteristic of our economy,” Minsky wrote in 1974, “is that the financial system swings between robustness and fragility, and these swings are an integral part of the process that generates business cycles.” [Wikipedia]
Minsky came to mind because in the past week I saw yet more signs that financial markets are overvalued and investors excessively optimistic. Yet I still haven’t seen many references to Minsky. That’s a little surprising.
On reflection, I realized I hadn’t mentioned Minsky lately, either. That is a potentially dangerous oversight, because we forget his fundamental insights at our peril. Last week’s brief technology tumble should have been a wake-up call. So today we’ll have a little Minsky refresher and look at some recent danger signs. And I predict that we will soon see Minsky mentions popping up everywhere.
Natural Instability
Hyman Minsky, who passed away in 1996, spent most of his academic career studying financial crises. He wanted to know what caused them and what triggered them. His research all led up to his Financial Instability Hypothesis. He thought crises had a lot to do with debt. Minsky wasn’t against all debt, though. He separated it into three categories.
The safest kind of debt Minsky called “hedge financing.” For example, a business borrows to increase production capacity and uses a reasonable part of its current cash flow to repay the interest and principal. The debt is not risk-free, but failures generally have only limited consequences.
Minsky’s second and riskier category is “speculative financing.” The difference between speculative and hedge debt is that the holder of speculative debt uses current cash flow to pay interest but assumes it will be able to roll over the principal and repay it later. Sometimes that works out. Borrowers can play the game for years and finally repay speculative debt. But it’s one of those arrangements that tends to work well until it doesn’t.
It’s the third kind of debt that Minsky said was most dangerous: Ponzi financing is where borrowers lack the cash flow to cover either interest or principal. Their plan, if you can call it that, is to flip the underlying asset at a higher price, repay the debt, and book a profit.
Ponzi financing can work. Sometimes people have good timing (or just good luck) and buy a leveraged asset before it tops out. The housing bull market of 2003–07, when people with almost no credit were buying and flipping houses and making money, attracted more and more people and created a soaring market. The phenomenon fed on itself. Bull markets in houses, stocks, or anything else can go higher and persist longer than we skeptics think is possible. That is what makes them so dangerous.
Minsky’s unique contribution here is the sequencing of events. Protracted stable periods where hedge financing works encourage both borrowers and lenders to take more risk. Eventually once-prudent practices give way to Ponzi schemes. At some point, asset values stop going up. They don’t have to fall, mind you, just stop rising. That’s when crisis hits.
The Economist described this process well in a 2016 Minsky profile article. (Emphasis mine.)
Economies dominated by hedge financing – that is, those with strong cashflows and low debt levels – are the most stable. When speculative and, especially, Ponzi financing come to the fore, financial systems are more vulnerable. If asset values start to fall, either because of monetary tightening or some external shock, the most overstretched firms will be forced to sell their positions. This further undermines asset values, causing pain for even more firms. They could avoid this trouble by restricting themselves to hedge financing. But over time, particularly when the economy is in fine fettle, the temptation to take on debt is irresistible. When growth looks assured, why not borrow more? Banks add to the dynamic, lowering their credit standards the longer booms last. If defaults are minimal, why not lend more? Minsky’s conclusion was unsettling. Economic stability breeds instability. Periods of prosperity give way to financial fragility.
Minsky’s conclusions are indeed unsettling. He called into question the belief that markets, left to operate unimpeded, will deliver stability and prosperity to all. Minsky thought the opposite. Markets are not efficient at all, and the result is an occasional financial crisis.
Complacency in the midst of a wanton debt buildup was beautifully expressed in a remark by Citigroup Chairman Chuck Prince in 2007:
The Citigroup chief executive told the Financial Times that the party would end at some point, but there was so much liquidity it would not be disrupted by the turmoil in the US subprime mortgage market.
He denied that Citigroup, one of the biggest providers of finance to private equity deals, was pulling back.
“When the music stops, in terms of liquidity, things will be complicated. But as long as the music is playing, you’ve got to get up and dance. We’re still dancing.” [source]
Minsky wasn’t around to see the 2008 crisis that fit right into his theory. Paul McCulley attached Minsky’s name to it, though, and now we refer to these crises as “Minsky moments.”
Are we closing in on one now?
Learning the Rules
As I mentioned, technology stocks suffered from a little anxiety attack in the markets last week. It didn’t not last long and really wasn’t all that serious. (Yet.) It was nothing worse than what everyone called “normal volatility” ten years ago. But the lack of concern it generated this time is not bullish, in my view. More than a few investors seem to think that “nowhere but up” is somehow normal.
Doug Kass had similar thoughts (there’s that Zeitgeist trope thing again) and reminded us all of Bob Farrell’s famous Ten Rules of Investing. You could write a book about each one of them. I’ll just list them quickly, then apply some of them to our current situation. (Emphasis mine.)
1. Markets tend to return to the mean over time.
2. Excesses in one direction will lead to an opposite excess in the other direction.
3. There are no new eras – excesses are never permanent.
4. Exponential rapidly rising or falling markets usually go further than you think, but they do not correct by going sideways.
5. The public buys most at the top and the least at the bottom.
6. Fear and greed are stronger than long-term resolve.
7. Markets are strongest when they are broad and weakest when they narrow to a handful of blue-chip names. (Sound familiar? Can you say FAANGs?)
8. Bear markets have three stages: sharp down, reflexive rebound, and a drawn-out fundamental downtrend.
9. When all the experts and forecasts agree, something else is going to happen.
10. Bull markets are more fun than bear markets.
I think most of these rules are obvious to investors who experienced the 2008 mess, the dot-com crash, and (if you’re of a certain age) the 1987 Black Monday. Some of us can remember 1980 and ’82. ’82 was especially ugly. (I had just gotten my master of divinity degree, and all I knew was that the job market sucked.) Maybe we mostly forget these experiences, but hopefully we pick up a little wisdom along the way. The problem is that now a new generation of investors lacks this perspective. They had little or no stock exposure in 2008 and experienced the Great Recession as more of a job-loss or housing crisis than a stock market crisis.
Of course, the previous crises are no secret. People know about them, and on some level they know the bear will come prowling around again, eventually. But knowing history isn’t the same as living through it. Newer investors may not notice the signs of a top as readily as do investors who have seen those signs before – and who maybe got punished for ignoring them at the time.
Doug Kass notices. Here’s a bit from an e-mail conversation we had last week.
During the dot.com boom in 1997 to early 2000 there was the promise (and dream) of a new paradigm and concentration of performance in a select universe of stocks. The Nasdaq subsequently dropped by about 85% over the next few years.
I got to thinking how many conditions that existed back then exist today – most importantly, like in 1999, when there emerged the untimely notion of “The Long Boom” in Wired magazine. It was a new paradigm of a likely extended period of uninterrupted economic prosperity and became an accepted investment feature and concept in support of higher stock prices!
[JM note: Here’s the Wired article Doug mentions: “The Long Boom: A History of the Future, 1980-2020.”]
And in 2007 new-fangled financial weapons of mass destruction – such as subprime mortgages that were sliced and diced during a worldwide stretch for yield – were seen as safe by all but a few.
And, just like during those previous periods of speculative excesses, many of the same strategists, commentators, and money managers who failed to warn us then are now ignoring/dismissing (their favorite phrase is that the “macroeconomic backdrop is benign”) the large systemic risks that arguably have contributed to an overvalued and over-loved U.S. stock market.
Doug points especially to Farrell’s Rule 7, on market breadth. A rally led by a few intensely popular, must-own stocks is much less sustainable than one that lifts all boats. We see it right now in the swelling interest in FAANG (Facebook, Apple, Amazon, Netflix, Google). Tesla comes to mind, too. Their influence on the cap-weighted indexes is undeniably distorting the market. These situations rarely end well.
Chinese Minsky
What is behind these distortions? Ultimately, it’s about capital flows. Asset prices rise when demand outstrips supply, which is what happens when stocks or real estate or whatever are perceived as more rewarding than cash. Those with the most unwanted cash compete with each other to buy the alternatives.
The Fed and other developed-country central banks created a lot of liquidity in recent years, so that’s undoubtedly a factor. An even greater one may be China, though.
Consider China’s explosive growth. Its proximate cause is US demand and, to a lesser extent, European demand for Chinese exports. We sent them our dollars and euros; they sent us widgets and doodads. US dollars inside China are undesirable to wealthy Chinese and the Chinese government, so they send the dollars right back to us in exchange for other assets: homes, commercial real estate, stocks, Treasury bonds, entire companies.
Meanwhile, within China, the government aggressively encourages lending for projects a free economy would never produce. Let me make a critical point here: While the central bank of China is not doing much in the way of quantitative easing, the government’s use of bank lending gone wild is essentially the same thing. The banks have created multiple trillions of yuan every year for many years. If you add Chinese bank lending statistics to the quantitative easing statistics of the world’s major central banks, the number is staggering. I think it’s entirely appropriate to perform that calculation.
Beijing thinks this massive bank lending is useful in keeping the population happy, employed, and satisfied with their government. It has worked pretty well, too. It can’t work indefinitely, but the government seems bent on trying. Consider this June 14 Wall Street Journal report.
While Beijing is carrying out a high-profile campaign to reduce leverage in its financial markets with one hand, with the other it is encouraging more potentially reckless borrowing. This week, the regulator put pressure on the country’s big banks to lend more to small companies and farmers, while the government announced tax breaks for financial institutions that lend to rural households. That follows recent guidance that banks should set up “inclusive finance” units.
If the goal of lending to poorer customers sounds noble, the concern is that the execution will only worsen Chinese banks’ existing problems, namely high levels of bad loans and swaths of mispriced credit. Bank lending to small companies is already growing pretty fast, with non-trivial sums involved: It jumped 17% in the year through March to 27.8 trillion yuan ($4.084 trillion). That compares favorably with the 7% rise in loans to large- and medium-size companies over the same period.
Observers like me have been saying for years that China’s banking system is overleveraged and will eventually collapse. We’ve been wrong so far. Beijing’s central planners may be Communists, but they use the capitalist toolbox to their advantage.
 China will eventually face a reckoning. When it does, the impact will spread far outside China. What do you think will happen when Chinese money stops buying Vancouver real estate and US stocks? The outcome won’t be bullish.
The Swiss National Bank Is Doing What?
Pity the poor Swiss government. They have run their country well and don’t have a great deal of debt. They are a small country of just 8 million people, but they make an outsized impact on economics and finance and money.
Because Switzerland is considered a safe haven and a well-run country, many people would like to hold large amounts of their assets in the Swiss franc. Which makes the Swiss franc intolerably strong for Swiss businesses and citizens. So the Swiss National Bank (SNB) has to print a great deal of money and use nonconventional means to hold down the value of their currency. Their overnight repo rate is -0.75%. That’s right, they charge you a little less than 1% a year just for the pleasure of letting your cash sit in a Swiss bank deposit.
And the SNB is buying massive quantities of dollars and euros, paid for by printing hundreds of billions in Swiss francs. The SNB owns about $80 billion in US stocks today (June, 2017) and a guesstimated $20 billion or so in European stocks (which guess comes from my friend Grant Williams, so I will go with it).
They have bought roughly $17 billion worth of US stocks so far this year. They have no formula; they are just trying to manage their currency. Think about this for a moment: They have about $1000 in US stocks on their books for every man, woman, and child in Switzerland, not to mention who knows how much in other assorted assets, all in the effort to keep a lid on what is still one of the most expensive currencies in the world. I gasp at prices every time I go to Switzerland. (I will be in Lugano for the first time this fall.)
Switzerland is now the eighth-largest public holder of US stocks. It has got to be one of the largest holders of Apple (see below). What happens when there is a bear market? Who bears the losses? Print just more money to make up the difference on the balance sheet? Do we even care what the Swiss National Bank balance sheet looks like? More importantly, do they really care? We all remember European Central Bank President Mario Draghi’s famous remark, that he would do “whatever it takes” to defend the euro. We could hear the Swiss singing from the same hymnbook, by and by.
The point is that central banks and governments all the world are flooding the market with liquidity, which is showing up in the private asset markets, in stock and housing and real estate and bond prices, creating an unquenchable desire for what appear to be cheap but are actually overvalued assets – which is what creates a Minsky moment.
Now, remember what Minsky said. When an economy reaches the Ponzi-financing stage, it becomes extremely sensitive to asset prices. Any downturn or even an extended flat period can trigger a crisis.
While we have many domestic issues that could act as that trigger, I see a high likelihood that the next Minsky moment will propagate from China or Europe. All the necessary excesses and transmission channels are in place. The hard part, of course, is the timing. The Happy Daze can linger far longer than any of us anticipate. Then again, some seemingly insignificant event in Europe or China – an Austrian Archduke’s being assassinated, or what have you – can cause the world to unravel.
It’s a funny world. We have our rashes of zombie movies and 20 people in all corners of the planet inventing the same thing at the same time. And we have our central banks and governments exhibiting unmistakable herd behavior and continuing to do the same foolish things over and over. They never really intend to have the crisis that ensues.
 Remember Farrell’s Rule 3: There are no new eras. The world changes, but danger remains. Gravity always wins eventually. It will win this time, too. And when it does, we will begin undergo the Great Reset.

Monday, 6 February 2017

Long and short term credit cycles

This is one for those who really like to be challenged, and who want a really high grade; it's core thesis is not difficult, and is what we have just covered - during a long credit cycle we borrow, spend, and build up debt; when it gets a bit much we slow our borrowing. As we slow our borrowing, the central bank cuts rates to boost consumption - but (and here's the bit that you can use), we're still in debt from the first round, so rates have to go lower in order to drive borrowing and spending. The next time we slow down, we have MORE debt, so rates have to go even lower, and this process continues through "short" credit cycles, until we get the daddy of all blowouts - which we are in the process of trying to work our way through now.

There is a lot in here, and if you do read it it should give you a sense of satisfaction, and some useful material for essays. At the very least, when the next crisis comes, and they ask who saw it coming, you can put your hand up and say: "Me!"

Conventional economic “wisdom” fails to understand the role of credit/debt in our market based system.

Mainstream economics completely neglects to understand not only credits affect on demand, but also how this credit demand fluctuates in both short and long-term cycles. A debt cycle is simply the logical progression of large economic sequences that follow a certain order. These sequences arise due to predictable human nature and the inherent structure of our monetary system.

Here’s a quick overview of how the economic machine and debt cycles work: 

The economic machine starts with money, or more specifically, what we think of as money; which is cash + credit. Mainstream economics tends to focus solely on physical hard cash. But it is credit that makes up the majority of transactions in the world. In the US, the supply of physical cash amounts to roughly $3 trillion. But total credit is near $60 trillion. Most buying (demand) is through credit, not cash. It’s important to know this because though many people mistakenly think of credit as cash, the two actually work very differently. And it’s this difference that has compounding second and third order large scale effects.

You see, when you buy something with cash, you exchange that cash for a service or good. The transaction is closed. Complete. There is no further obligation between the two parties. 

When you buy something with credit, you exchange credit (a promise to pay in the future) for a good or service now. That transaction is not complete until the borrower pays off that debt. So in this instance, credit or money is created out of thin air, without the help of the central bank or US treasury. 

All you need is two willing parties and credit (money) can be created. An asset to the lender is created, as well as a liability to the debtor, that lasts until the transaction is closed by the debt being repaid. It is this ability to create “money” independently through credit purchases that compounds over time and builds cycles. And it is these credit cycles that drive the economic machine. 

 There are three primary forces that drive the economy over time. These are: 


 (Charts via Bridgewater “How The Economic Machine Works”) 


 Long-Term Productivity Growth 

Over time, the economy (real GDP per capita) averages 2% growth. This is the result of efficiency gains born from the accumulation of knowledge — we become more productive over time. It’s this steady build up of knowledge (advancements in our technology and know how) that drives productivity and results in the continuous improvement of our living standards. 

 Many of us love to be pessimistic about the current state of the world, complaining that “things were so much better back in the day”. But were they? Truth is, we as a society have it pretty good when compared to the generations before us. 

But we are interesting creatures. We’re not satisfied with just a 2% average increase in living standards. We base the quality of our lives in comparison to those around us (usually those who are wealthier than us). And in addition to our instinctual pettiness, we’re actually neurologically wired with the propensity to live beyond our means. 

Jason Zweig explains this phenomena in his excellent book Your Money and Your Brain: How the New Science of Neuroeconomics Can Help Make You Rich: “You would expect logically that the borrowing and spending of money would be emotionally painful to people because having money is intrinsically a good thing, and having less money would have to be worse… Going from more money to less would be painful. When people borrow and spend money, it’s really the reward centers of the brain that become activated… When you borrow money, you are thinking not about the long-term consequences but the short-term result: You have more cash in your pocket. The pain you are going to experience down the road of having to pay — that’s in the future, it’s remote, it’s abstract.” 

 So credit is like a drug… we’re addicted to shots of dopamine that we receive every time we purchase something. We are literally programmed to overvalue present rewards and greatly underestimate future costs. 

Credit allows us to delude ourselves into thinking we can outpace this 2% trend. But in the long run we can only consume (spend) as much as we produce (earn). When we spend more than we earn we create bad debts — debts that will not be repaid. The way we’re wired and the structure of our credit system clashes with the limits of our average long-term productivity growth. This irreconcilable difference creates cycles. These cycles, that oscillate around the 2% productivity trendline are called debt cycles. They’re comprised of leveragings and deleveragings of debt/credit. 

 A debt leveraging occurs as we increase our debt spending over time (total debt load relative to income). By doing so we pull future consumption forward while causing temporary increases in productivity above the 2% trendline average. Eventually these leveragings reach a saturation point where debt servicing costs relative to incomes grow too large. They begin to hamper demand growth. When that point is reached, the economy will begin a deleveraging. 

In a deleveraging, we fall below the 2% productivity trendline. The chart below (again, via Bridgewater) shows the overlay of all three forces over the last 100 years.  


These leveragings and deleveragings are the result of the long-term and short-term debt cycles. 

The Short-Term Debt Cycle 

The short-term debt cycle (otherwise known as the business cycle) is fairly well understood, since it tends to occur every 5-7 years. These short-term cycles result from the easing and tightening of money by the Federal Reserve Bank. 

Here’s a quick rundown of what happens when the Fed eases (lowers interest rates). The three immediate impacts of lower interest rates are: 
1.New credit becomes more attractive, so people and businesses borrow more money. 2.Existing debt becomes cheaper to service, since its interest payments are now lower. 3.The discount rate at which businesses and financial assets are valued is lowered (a lower discount rate increases present value, making an asset more attractive). Investors then bid up these assets, moving further out on the risk curve, causing spreads between financial instruments (ie, cash, bonds, equities) to tighten. 


The beautifully hand drawn chart above shows the spread between financial assets. When spreads widen (higher interest rates), risk premiums go up and investors get more return for assuming risk. And when spreads tighten (lower interest rates) the risk premiums go down and investors get less return for assuming risk. 

Cheaper debt increases borrowing and boosts demand. People and businesses borrow and spend more. And since one person’s spending is another’s income, incomes rise, further driving demand. Increasing demand inflates asset prices (ie, homes, business, stocks etc.). 

When asset prices rise, people’s net worth rises, as well as their credit profiles. This allows them to borrow more. And since we’re strongly affected by recency bias and myopia, we extrapolate this current income growth into the future. We expect it to continue and borrow even more. This is a reflexive process. Increased borrowing raises demand which drives up incomes and inflates asset prices. Higher asset prices result in stronger credit profiles which lead to more lending/borrowing. A positive feedback loop is created. 

This process goes on until rising demand bumps up against productive capacity and we get demand-pull inflation. Productive capacity is the limit of what an economy can produce. 

Credit demand can be created much faster than what an economy can realistically support. When this happens, inflation begins to accelerate because there’s more demand than what suppliers can handle. Too much money begins chasing after too few goods (which drives up prices). The result is demand-pull inflation. One of the Federal Reserve’s mandates is to regulate inflation. So when inflation begins to rise, the Fed is forced to raise interest rates. Once they do, the feedback loop goes into reverse. 

The cost of debt increases due to higher interest rates. This causes money to tighten and demand to fall as people and businesses borrow and spend less. And since one person’s spending is another’s income, incomes drop, further decreasing demand. The fall in demand causes asset prices to drop which lowers the credit profiles of borrowers, resulting in less lending. The discount rate rises and widens the spread between financial assets (ie, stocks and bonds sell off and become less attractive)… and on and on it goes. 

Until the Fed cuts rates once again. But this time, since debts are now higher than they were when the Fed previously lowered rates (meaning more income has to go to debt servicing), the Fed has to cut interest rates even lower than they were before. 

You can see this logical sequence of events in the chart below. It shows the Fed Funds Rate over two short-term business cycles. Debt Cycles From 99’ to 00’ the Fed raised interest rates until demand and asset prices started to fall and the economy went into recession. 


The Fed then quickly cut interest rates to a point lower than the previous cycle low. 

The short-term cycle repeated itself again in 04’ to 07’, when the Fed raised rates to subdue inflation. But interest rates were raised to a lower point than the previous cycle. And then in 08’ the Fed was forced to lower them again to fight off recession — and they were dropped to a new secular low. 

Short-term business cycles repeat over time. Each time, interest rates move lower. Interest rates have to move lower because debt (and the costs to service it) keep on rising, in both the public and private sector. 

This sequence continues until rates cannot be lowered any more (they reach zero or negative). This is the point at which a pivot in the long-term debt cycle takes place. 

 The Long-Term Debt Cycle 

 Longer term debt cycles are not well understood by the public. This is because they operate on a longer timeframe (hence the name). The cycle only becomes very noticeable at transition points, which generally occur once every generation, about every 25-50 years. 


Looking at the chart above, you can see the long-term debt cycle at work. Interest rates peaked in 1920 and then turned over and began trending lower (which led to the roaring 20’s). 

They bottomed out in the 30’s – 40’s before trending higher again for the next 40 years. In 1981 they peaked again and have been trending lower ever since. 

Total debt accumulates over the long-term as shown in the chart below. 


You can see two debt mountain peaks. One in 1929 where total debt peaked at 260% to GDP. And then the peak today where debt is at 380% to GDP. 

Most people focus on public debt (debt owed by the government) at the exclusion of private debt (debt owed by households and corporations). This is wrong. Though public debt is important, private debt is the primary driver of debt cycles. Private debt is where the demand comes from that propels the economy. Also, governments can more easily manage their debt by monetizing it through central banks. 

Unfortunately, the private side doesn’t have this option. The accumulation of debt cannot go on ad infinitum. The reason being that eventually interest rates cannot be lowered any further to keep things going. They reach the zero bound and no amount of credit easing can induce people to borrow and spend more. Accumulated debt levels become too high and the servicing costs too large. The credit system literally becomes maxed out. And that’s a summary of the role that both short and long-term debt cycles play in markets. It’s a significant one… especially at the turning points.


And this is where we are now. We’re at the turning point of the long-term debt cycle. The last time we were here was in the 1930’s… the Great Depression.
Interest rates across the majority of the developed world are now at or below zero. There is over $7 trillion in negative yielding debt! $7 trillion dollars! This is not how a true capitalistic system should work. But it’s exactly how our current system is expected to work.
Global Negative Bond Rates
One thing that is different this time around versus the 1930s is that the global economy on a whole is much… much… much more leveraged. In fact, the world has never had as much debt relative to GDP as it does now… not even close.
Global Debt Levels
The deleveraging that everybody thought was happening in 2009 was just kicked down the road to today. This was possible because there was still room for interest rates to fall to squeeze a bit more credit demand into the system.
Now, with rates at zero and the efficacy of quantitative easing maxed out, the can cannot be kicked any further.
Since 2009, both the developed and developing world have seen their debt-to-GDP levels rise on average by 35%. A report done by Mckinsey last year suggested the world had added an additional $57 trillion of new debt since 08’ — a figure which is undoubtedly higher today.
In 2009, China and emerging markets were the key to boosting global demand to help stave off a global depression. But this time around they’re a major part of the problem.
Over the last seven years, China has seen its debt-to-GDP level increase from 160% to over 250%. Their total debt accounts for over half the debt of the developing world. It’s estimated that China is adding to this debt at the rate of $6-7 trillion a year. You may be thinking “well, maybe this credit is being invested in high-return projects”, but you’d be wrong. Our estimates (and those of others) have well over half of China’s new debt issuance in the last few years going to pay interest on existing debt!
It appears the Chinese truly believe in the maxim, “a rolling loan gathers no loss”. We’ll see how long they can keep that up…
Economist and central bankers have been scratching their heads as to why global growth has been so sluggish and inflation so difficult to create. Well if they just understood the dynamics of the long-term debt cycle as I’ve described to you here, it wouldn’t be such a mystery.
This oppressive level of debt is pulling current demand lower through debt servicing costs. The lower demand combined with an economy that has a capacity glut (built on credit) results in deflation. The kind of deflation that will take a decade to work through.
What about Piketty? Is he right? Are our current woes the result of capitalism being a broken system? Not exactly…
The fuss over income inequality and the strain it puts on our society is a definitely real. Income inequality has been steadily increasing since the late 70’s. You can see this on the chart below.
Wealth Gap In US
But income inequality is not due to return on capital outpacing the rate of growth (meaning the return on invested money outpaces real growth; the rich get richer faster than the overall growth of the economy) as Piketty argues.
This is a correlative link, not a causative one. Return on capital has been outpacing the return on growth over the last 45 years because of the long-term debt cycle and the continuous lowering of interest rates by the Fed. Remember, interest rates have been steadily falling since 1981 (right when income inequality began rising).
The rich are richer because they own (mainly through credit) more assets (ie, financial, property, business etc). These assets have been inflated on the back of credit/debt growth over the course of the leveraging part of this long-term debt cycle.
Knowing this, it should be of no surprise that some of the people we think of as super-rich are in reality not very wealthy at all, meaning their assets don’t outweigh their liabilities. They just have access to far more credit than most people. They’re drowning in debt… cough… Kanye… cough.
Celebrity Debtor
And it’s not just Kanye… over the last 35 years, we as a society have pulled a lot of future consumption forward. We’ve been enjoying the future fruits of our labor today, by going crazy for those shots of credit induced dopamine. We’ve mistaken increasing debt for rising prosperity. But now the future is banging on our door demanding we pay our bill.
Bill Gross of Janus Capital commented on this in his recent investors letter (emphasis added is ours):
“What readers should know is that the global economy has been powered by credit – its expansion in the U.S. alone since the early 1970’s has been 58 fold – that is, we now have $58 trillion of official credit outstanding whereas in 1970 we only had $1 trillion.”
A 58 fold increase in credit in just under 50 years is a huge leveraging. This build up in debt is going to have a large impact on the US and the world moving forward. It’s going to affect everything from growth, to living standards, to domestic politics (ummm… Trump & Sanders), and geopolitics (ie, international conflict).
Think of the period following the 30’s. We are likely in for some interesting times ahead.
This is what’s going to happen going forward
We are at the beginnings of both a secular (long-term) and cyclical (short-term) deleveraging. And this is happening all around the globe.
This short-term deleveraging cycle began last year. That’s why volatility has come back in force. What many people (including central bankers) don’t realize is that the Fed has already tightened by over 3.25%, far more than just the 25bps hike from last December. This is because of the easing effect of QE and the tightening that resulted by ending it in October, 2014. This tightening effect can be seen in the Shadow Federal Funds rate (ironically, created by researchers at the Fed).
Wu-Xia Tightening
This hiking cycle is now likely over and the Fed’s next actions will be to cut — but they won’t be able to cut much because they’re straight outta ammunition (hence why we’re at the transition point of the longer-term cycle).
The tightening effects of the Fed’s rate hikes take a while to work their way through the economic system. You can expect further volatility and evaporating demand as the effect of these increased rates is felt, while at the same time the deleveraging picks up steam.
Remember, deleveragings are the destruction of demand. Falling demand means lower asset prices — creating that deflationary feedback loop. This is why commodity prices have been cratering since 2014. And this is why they will continue to fall over the coming year.
Commodity Crash
At this point, traditional monetary easing has become equivalent to “pushing on a string”… it’s just not working. Negative rates don’t work, and in fact, they have a net-negative impact on lending and demand. Central bank policy aimed at getting investors to assume more risk has contracted spreads as tight as they’ll go. So we can expect negative real-returns over the next decade.
The only option left for many central banks is the route they’ve taken EVERY SINGLE TIME throughout history when faced with a secular deflationary deleveraging. And that is: unorthodox monetary policy. Otherwise known as straight up debt monetization through haircuts/restructurings and inflation.
Since debt deleveragings are a deflationary force, the central banks need to create enough of an inflationary force to counteract it. They need to monetize the debt (using inflation to devalue it) so nominal asset prices remain somewhat stable as borrowers are relieved of their debt burdens. The goal is to keep nominal GDP above nominal interest rates. Keeping nominal growth above the nominal cost of debt allows debt to be properly monetized over time.
This will be accomplished through more quantitative easing and something akin to a “helicopter drop”, where the government does a wealth transfer and assumes a lot of private debt. If this is carried out perfectly (and that’s a BIG “if”), where inflation is created in just the right amount to counteract deflationary pressures, then we’ll have what Dalio calls a “beautiful deleveraging”.
A beautiful deleveraging is the least-worst option (the others being a deflationary deleveraging and a runaway-inflationary deleveraging like 1930s Weimar Germany).
There is no easy way out of this. A beautiful deleveraging will still be very painful and is not easy to carry out. This is a point that many fail to understand. You can’t just raise interest rates right now. It’s toolate. It would result in a deflationary deleveraging — which is the most painful option of all. We have over a generation of debt built up. Much of which is just bad debt. It’s worthless and will not be repaid.
This long-term cycle of debt accumulation and then debt monetization is so ingrained and prevalent throughout human history, that even the Bible talks about having a year of “Jubilee” every 50 years, where all debts are all wiped clean.
Well, our global jubilee is upon us. But unlike biblical times, creditors will not willingly forgive debts out of the goodness of their hearts. The debts will be forgiven in the most opaque way possible, so we can all still remain in denial of the reality of our monetary system. The debt will be inflated away through the devaluation of currencies.
But the inflationary period caused by this devaluation will not start for another couple of years, at least not in the US. There are two primary reasons for this:

  1. The Fed does not understand the secular dynamics at work. They’re committed to maintaining their credibility by following their planned rate hikes — of which they will be lucky to get even one more in.
  2. Because of the Fed’s mandate and the current political environment, they will not have the political capital to enact unorthodox monetary policies until things get very… very… bad.
We are at the very start of that very bad part. Despite recent volatility, US financial assets are still near record high levels. Markets are in the beginning stages of rectifying this valuation discrepancy and are about to get knee-capped back down to earth (or their 2008 lows).
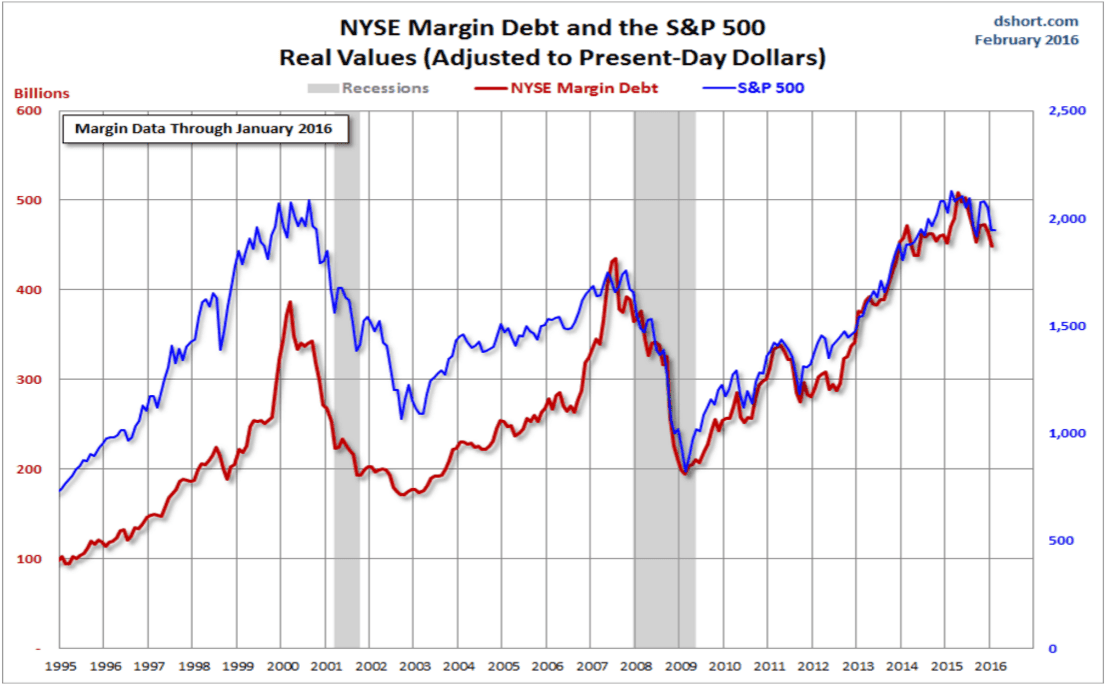
The chart below shows the inflation adjusted S&P 500 overlaid on NYSE margin debt. This margin debt (most stock buying is done with debt) is starting to unwind (from record high levels). This has preceded the last two market crashes and is flashing signs of the next one, soon to come.
Margin Reduction Sign Of Coming Crash
An interesting side note: It is the buying of financial assets on margin (with debt) that creates massive amounts of instability and liquidity issues within markets. Margin buying increases as markets rise. Players become more leveraged as equity valuations become more unsustainable. When the cycle turns, you have a lot of margin-bought-securities trying to squeeze through a narrow exit at the same time. Selling begets forced selling and so on. (Pay attention and you’ll notice how “reflexivity” as described by George Soros, is a recurring part of the inherent nature of markets and economies.)
Credit markets, which serve as the canary in the coal mine to the broader economy, have been sounding cries of warning for some time. And as yields creep higher, liquidity is squeezed, and we quicken our march towards the proverbial cliff.
High Yield Debt Rates
The US dollar will grow stronger during the beginning stages of this global deleveraging.
There is over $12 trillion in outstanding USD denominated debt held outside of the US. This is the result of a popular carry trade driven by the Fed’s loose monetary policy. USD debt is essentially a short position on the dollar (as the dollar falls, USD debt becomes cheaper to service).
The trade worked well when the dollar was weakening, but now that its strengthening, companies and other institutions have an incentive to pay off their debt faster than before to avoid rising servicing costs. To pay off that debt, the debtors have to trade their currency for dollars. This boosts demand for dollars, which raises USD value compared to other currencies. It turns into a reflexive process that goes on and on.
We’re only in the middle of this dollar move. It’s been experiencing an expected and healthy retracement that will continue over the next month as weak hands get shaken out, but it will get back to its bullish trend very shortly.
Bullish Dollar Trend
Since the dollar is the reserve currency of the world, a strengthening dollar impacts global assets in interesting ways.
First, all commodities are priced in USD. So when the dollar rises, it acts as a weight on commodities. It is no coincidence that the dollar bull market coincided perfectly with the collapse in oil. Historically, the dollar accounts for 30-50% of the larger trend in oil.
It is our understanding of this correlation that allowed us to anticipate and profit from the collapse in oil and other commodities that began in 2014. And it is also this understanding that leads us to believe that the fall in commodities is not yet over.
We predict that oil won’t bottom until it hits the teens. The carnage won’t stop until there’s blood in the oil streets. Though things are bad in the oil patch now… they are going to get much worse.
And for you gold bugs out there, the recent rally in gold is an epic bull-trap. The dollar has macro drivers equivalent to an Atlas-V rocket and liftoff is just beginning. Since gold is priced in dollars, it cannot maintain a bullish rally while the dollar stays strong. This is why the gold rally will be short-lived.1
There will be a time to own gold, but that time won’t be for at least another year when dollar inflation really kicks in through the “unconventional monetary policy” we discussed before.
As the world’s reserve currency (USD) strengthens, it acts as a monetary tightening on the rest of the system. This is because, as we discussed, the world is net-short dollars since it is a large funding currency. So when the dollar rises, it sucks liquidity away from credit markets around the world. This further spurs deflation, driving asset prices and markets lower (which is why emerging markets have fallen into the crapper).
The beginnings of the next global crisis have already been put in motion. It’s inevitable and cannot be stopped. It can only be managed.
The crisis will begin in Europe, where banks have admitted to holding over $1 trillion in non-performing loans — we believe the actualnumber to be much higher. The western European continent is awash in bad debt and saddled with a bloated bureaucracy that is ill-equipped to handle the coming storm. Look at the state of Ireland in the charts below… I mean, Dear God… how did that happen?
Irish Debt Problems
The coming crisis will lead to the slow fracture and breakup of the European Union as we now know it.
Countries like Greece, Ireland, Italy, Portugal, Spain, and possibly even France (though many believe it impossible) will be found insolvent. The euro will continue to fall which will boost the dollar even more.
This rising dollar will force China’s hand into floating the Yuan to manage their exports, bad debts, etc. This contagion will spread across the world, as developing countries from Brazil to South Africa try to do the same. They will likely all lose control of their currencies a la 1997 asian financial crisis… but this time on steroids.
This will cause the deflationary tidal wave (which we discussed in the first Horseman piece) that will crash upon US shores in the coming year.
Jim Rogers, legendary investor and former partner of George Soros at the Quantum Fund, recently said in an interview that there “is a 100% chance of a U.S. recession within a year.” He also discussed various drivers causing the start of a bubble in the dollar.
We couldn’t agree more. We predict the US will start a recession in the fourth quarter. And the dollar will be significantly higher than it is today by the end of the year (after a quick retracement in the near-term).