Quote of the day

“I find economics increasingly satisfactory, and I think I am rather good at it.”– John Maynard Keynes
Showing posts with label aggregate demand. Show all posts

Wednesday, 16 November 2022

Fiscal drag is a drag...


Britain will pay a high price for the Tory party’s new magic money tree

Leaving tax thresholds unchanged may seem like an easy win for the Treasury, but it will be massively counterproductive


In 2017 Theresa May reminded the electorate that there isn't a magic money tree. Messrs Sunak and Hunt seem to have forgotten that lesson CREDIT: Graeme Robertson/Getty

Remember the “magic money tree”? Back in 2017, the Tories used the phrase to dismiss as pure fantasy Labour’s plans for boosting welfare spending without raising taxes. All fiscal decisions have consequences, they rightly argued. During lockdown, however, some imagined that the tree had actually been found, as central banks were accused of printing cash to enable governments to borrow with abandon. Today’s surging inflation is proof that they were wrong.

But now Rishi Sunak and Jeremy Hunt seem to believe they have found a magic money tree of their own. Their approach appears to have it all. It allows them to claim to be sticking to their manifesto promises by not increasing headline tax rates, while still boosting revenue by £30  billion a year. Through the simple expedient of freezing tax thresholds at a time of high inflation, they think they can balance the books without harming the economy or provoking a revolt among taxpayers.

This is so-called fiscal drag, a policy adopted by Sunak as chancellor in 2021 when he announced a five-year freeze in income tax thresholds. In this week’s Autumn Statement, that freeze is expected to be extended until 2028. But it has an even longer pedigree. When 40p became the top rate in 1988, it was paid by less than 4 per cent of the population – around 1.7 million people. This year it will be paid by six million. By 2026, the Institute for Fiscal Studies estimates that 7.7  million people will be paying tax at the higher rate.

Maybe the Government thinks we won’t feel the pain. In times of low inflation, taxpayers may not have resented HMRC dipping slightly deeper into their wages each year if they were lucky enough to get a pay rise. But nowadays, when heating bills have doubled in a year and the price of essential food items is soaring, handing over a bigger slice of income to the government will squeeze household budgets hard.

The biggest problem, however, concerns incentives. As the UK tips into recession and with the after-effects of the pandemic lingering on, there is a desperate need to boost work rates and economic activity. But for low earners currently paying no income tax, freezing the tax-free allowance for the next six years will make work less attractive. For those on basic-rate tax but close to the higher rate threshold, why work longer hours if for every extra pound earned the taxman will take 40p?

For families with children, the penalty could be much greater: as soon as a parent approaches the higher rate band, their child benefit is tapered off. Combine that cut with the cost of childcare and it’s hardly surprising if parents decide that working longer hours or seeking promotion is not worth the sacrifice.

This dampening of incentives will not only afflict businesses and wealth creation but poses a serious threat to the public sector, in particular the NHS. Why would hospital doctors or senior nurses increase their shifts and put in longer hours if it means a serious tax penalty? For GPs and consultants, the combination of a freeze in income thresholds and the cap on pension savings could mean extra hours at work would leave them worse off.

Leaving tax thresholds unchanged may seem like an easy win for the Treasury, but appearances can be deceptive. Stripping this supposed magic money tree of its fruit will leave the Conservatives with a bitter aftertaste if it shrinks the economy, reduces work rates and pushes more earners into early retirement.

Saturday, 31 October 2015

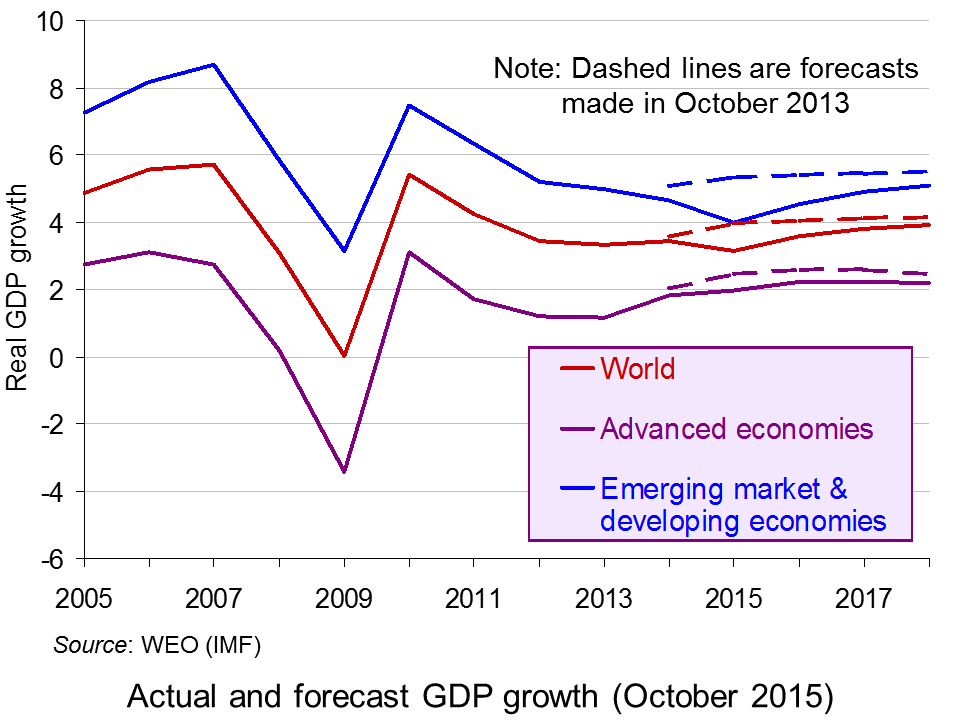
World economic outlook October 2015

from the excellent Pearson blog/website:

http://pearsonblog.campaignserver.co.uk/?cat=315&paged=2

What’s the outlook for the global economy?

The International Monetary Fund has just published its six-monthly World Economic Outlook (WEO). The publication assesses the state of the global economy and forecasts economic growth and other indicators over the next few years. So what is this latest edition predicting?
Well, once again the IMF had to adjust its global economic growth forecasts down from those made six months ago, which in turn were lower than those made a year ago. As Larry Elliott comments in the Guardian article linked below:
Every year, economists at the fund predict that recovery is about to move up a gear, and every year they are disappointed. The IMF has over-estimated global growth by one percentage point a year on average for the past four years.
In this latest edition, the IMF is predicting that growth in 2015 will be slightly higher in developed countries than in 2014 (2.0% compared with 1.8%), but will continue to slow for the fifth year in emerging market and developing countries (4.0% in 2015 compared with 4.6% in 2014 and 7.5% in 2010).
In an environment of declining commodity prices, reduced capital flows to emerging markets and pressure on their currencies, and increasing financial market volatility, downside risks to the outlook have risen, particularly for emerging market and developing economies.
So what is the cause of this sluggish growth in developed countries and lower growth in developing countries? Is lower long-term growth the new norm? Or is this a cyclical effect – albeit protracted – with the world economy set to resume its pre-financial-crisis growth rates eventually?
To achieve faster economic growth in the longer term, potential national output must grow more rapidly. This can be achieved by a combination of more rapid technological progress and higher investment in both physical and human capital. But in the short term, aggregate demand must expand sufficiently rapidly. Higher short-term growth will encourage higher investment, which in turn will encourage faster growth in potential national output.
But aggregate demand remains subdued. Many countries are battling to cut budget deficits, and lending to the private sector is being constrained by banks still seeking to repair their balance sheets. Slowing growth in China and other emerging economies is dampening demand for raw materials and this is impacting on primary exporting countries, which are faced with lower exports and lower commodity prices.
Quantitative easing and rock bottom interest rates have helped somewhat to offset these adverse effects on aggregate demand, but as the USA and UK come closer to raising interest rates, so this could dampen global demand further and cause capital to flow from developing countries to the USA in search of higher interest rates. This will put downward pressure on developing countries’ exchange rates, which, while making their exports more competitive, will make it harder for them to finance dollar-denominated debt.
As we have seen, long-term growth depends on growth in potential output, but productivity growth has been slower since the financial crisis. As the Foreword to the report states:
The ongoing experience of slow productivity growth suggests that long-run potential output growth may have fallen broadly across economies. Persistently low investment helps explain limited labour productivity and wage gains, although the joint productivity of all factors of production, not just labour, has also been slow. Low aggregate demand is one factor that discourages investment, as the last World Economic Outlook report showed. Slow expected potential growth itself dampens aggregate demand, further limiting investment, in a vicious circle.
But is this lower growth in potential output entirely the result of lower demand? And will the effect be permanent? Is it a form of hysteresis, with the effect persisting even when the initial causes have disappeared? Or will advances in technology, especially in the fields of robotics, nanotechnology and bioengineering, allow potential growth to resume once confidence returns? 
Which brings us back to the short and medium terms. What can be done by governments to stimulate sustained recovery? The IMF proposes a focus on productive infrastructure investment, which will increase both aggregate demand and aggregate supply, and also structural reforms. At the same time, loose monetary policy should continue for some time – certainly as long as the current era of falling commodity prices, low inflation and sluggish growth in demand persists.
Articles
Uncertainty, Complex Forces Weigh on Global Growth IMF Survey Magazine (6/10/15)
A worried IMF is starting to scratch its head The Guardian, Larry Elliott (6/10/15)
Storm clouds gather over global economy as world struggles to shake off crisis The Telegraph, Szu Ping Chan (6/10/15)
Five charts that explain what’s going on in a miserable global economy right now The Telegraph, Mehreen Khan (6/10/15)
IMF warns on worst global growth since financial crisis Financial Times, Chris Giles (6/10/15)
Global economic slowdown in six steps Financial Times, Chris Giles (6/10/15)
IMF Downgrades Global Economic Outlook Again Wall Street Journal, Ian Talley (6/10/15)
Questions
  1. Look at the forecasts made in the WEO October editions of 2007, 2010 and 2012 for economic growth two years ahead and compare them with the actual growth experienced. How do you explain the differences?
  2. Why is forecasting even two years ahead fraught with difficulties?
  3. What factors would cause a rise in (a) potential output; (b) potential growth?
  4. What is the relationship between actual and potential economic growth?
  5. Explain what is meant by hysteresis. Why may recessions have a permanent negative effect, not only on trend productivity levels, but on trend productivity growth?
  6. What are the current downside risks to the global economy?
  7. Why have commodity prices fallen? Who gains and who loses from lower commodity prices? Does it matter if falling commodity prices in commodity importing countries result in negative inflation?
  8. To what extent can exchange rate depreciation help commodity exporting countries?
  9. What is meant by the output gap? How have IMF estimates of the size of the output gap changed and what is the implication of this for actual and potential economic growth?
Share in top social networks!


Monday, 28 September 2015

AD & AS resources for Y12

http://beta.tutor2u.net/economics/series/aggregate-supply


http://beta.tutor2u.net/economics/topics/aggregate-demand


Videos:


Too noisy? A calmer view:


Aggregate Demand for Y12

Please use the following resources to embed AD material:


http://beta.tutor2u.net/economics/reference/aggregate-demand-ad


Aggregate means ‘total’ and in this case we use the term to measure how much is being spent by all consumers, businesses, the government and people and firms overseas.
Aggregate demand (AD) = total spending on goods and services


AD = C + I + G + (X-M)


C: Consumers' expenditure on goods and services: Also known as consumption, this includes demand for durables e.g. audio-visual equipment and vehicles & non-durable goods such as food and drinks which are “consumed” and must be re-purchased.


I: Capital Investment – This is spending on capital goods such as plant and equipment and new buildings to produce more consumer goods in the future. Investment includes spending on working capital such as stocks of finished and semi-finished goods.


Capital investment spending in the UK accounts for between 15-20% of GDP in any given year. Of this investment, 75% comes from private sector businesses such as Tesco, British Airways and British Petroleum and the remainder is spent by the government – for example building new schools or in improving rail or road networks. Investment has important effects on the supply-side as well as being an important component of AD.


A small part of investment spending is the change in the value of stocks. Producers may find either than demand is running higher than output (i.e. stocks will fall) or that demand is weaker than expected and below current output (in which case the value of stocks will rise.)


G: Government Spending – This is spending on state-provided goods and services including public goods and merit goods. Decisions on how much the government will spend each year are affected by developments in the economy and the political priorities of the government.
Government spending on goods and services is around 18-20% of GDP but this tends to understate the true size of the government sector in the economy. Firstly some spending is on investment and a sizeable amount goes on welfare state payments.


Transfer payments in the form of benefits (e.g. state pensions and the job-seekers allowance) are not included in current government spending because they are a transfer from one group (i.e. people paying income taxes) to another (i.e. pensioners drawing their state pension having retired, or families on low incomes).


X: Exports of goods and services - Exports sold overseas are an inflow of demand (an injection) into our circular flow of income and spending adding to aggregate demand.
M: Imports of goods and services. Imports are a withdrawal of demand (a leakage) from the circular flow of income and spending.


Net exports measure the value of exports minus the value of imports. When net exports are positive, there is a trade surplus (adding to AD); when net exports are negative, there is a trade deficit (reducing AD). The UK has been running a large trade deficit for several years now.


Components of Aggregate Demand - £bn, 2006 prices
Consumer SpendingGovernment ConsumptionFixed InvestmentExportsImports
2003859.3297.9221.9362.1409.6
2004887.2309.3235.7379.7438.0
2005912.6316.3244.4414.1468.4
2006928.8323.3258.1463.8515.3
2007954.7325.7277.3454.3507.3
2008946.0332.4258.3459.1498.6
2009912.2334.9215.1419.3445.1
2010921.0336.5221.2447.3480.1
2011916.4336.4215.9467.2481.5
2012927.4345.7217.0471.3494.9
Components of Aggregate Demand
Shocks to aggregate demand
  • Many unexpected events cause changes in the level of demand, output and employment
  • These events are called “shocks”. Some of the causes of AD shocks are as follows:
  1. A large rise or fall in the exchange rate – affecting export demand and second-round effects on output, employment, incomes and profits of businesses linked to export industries.
  2. A recession in main trading partners affecting demand for exports of goods and services.
  3. A slump in the housing market or a big change in share prices
  4. An event such as the credit crunch (global financial crisis) – involving a fall in the amount of credit available for borrowing by households and businesses.
  5. An unexpected cut or an unexpected rise in interest rates or change in government taxation and spending – for example deep cuts in government spending as part of fiscal austerity
These shocks will bring about a shift in the aggregate demand curve


The Aggregate Demand Curve


The AD curve shows the relationship between the general price level and real GDP
The AD curve
Aggregate Demand and the Price Level
There are several explanations for an inverse relationship between AD and the price level in an economy:
1.Falling real incomes: As the price level rises, the real value of people’s incomes fall and consumers are less able to buy the items they want or need. If over the course of a year all prices rose by 10 per cent whilst your money income remained the same, your real income would have fallen by 10%
2.The balance of trade: A persistent rise in the price of level of Country X could make foreign-produced goods and services cheaper in price terms, causing a fall in exports and a rise in imports. This will lead to a reduction in net trade and a contraction in AD
3.Interest rate effect: if the price level rises, this causes inflation and an increase in the demand for money and a possible rise in interest rates with a deflationary effect on the economy. This assumes that the central bank (in our case the Bank of England) is setting interest rates in order to meet a specified inflation target.
Shifts in the AD Curve
  • A change in the factors affecting any one or more components of aggregate demand i.e. households (C), firms (I), the government (G) or overseas consumers and business (X) changes planned spending and results in a shift in the AD curve. 
Shifts in the AD curve
Factors causing a shift in aggregate demand

Changes in Expectations Current spending is affected by anticipated income and inflation
  • When confidence falls, we see an increase in saving and businesses postpone investment projects because of worries over weak demand and lower expected profits.
Changes in Monetary Policy – i.e. a change in interest rates
  • If interest rates fall – this lowers the cost of borrowing and the incentive to save, encouraging consumption & investment
  • There are time lags between changes in interest rates and AD
Changes in Fiscal Policy Fiscal Policy refers to changes in government spending, taxation and borrowing
  • Income tax affects disposable income e.g. lower income tax raises disposable income and should boost consumption.
  • A budget deficit is a net injection of aggregate demand
Economic events in the world economy International factors such as the exchange rate and foreign income
  • A depreciation in a currency makes imports dearer and exports cheaper - the net result should be that UK AD rises
  • An increase in overseas incomes raises demand for exports. In contrast a recession in a major export market will lead to a fall in exports and an inward shift of aggregate demand.
Changes in household wealth
  • Changing share and property prices affect the level of wealth
  • Declining asset prices can hit confidence / a fall in expectations
Changes in the supply of credit
  • The availability of credit is vital for the smooth functioning of most modern economies
  • Many banks and other lenders are now more reluctant to lend
  • Interest rates on different loans have become more expensive

Exports - an injection into the circular flow and a component of AD


Thursday, 24 September 2015

Y12 AD & AS resources

More material to help you clarify and extend the material in class:


< br />


these resources can be found here, along with other topics:


Khan Academy resources AD & AS


Thursday, 10 September 2015

By popular demand:


The supply & demand videos:


Here is the one on the supply curve:


The Demand curve:


and how about equilibrium?


BUT REMEMBER!


In macro we us AD/AS, Price Level and Real National Output (RNO):