Quote of the day

“I find economics increasingly satisfactory, and I think I am rather good at it.”– John Maynard Keynes

Friday 30 June 2017

The Federal Reserve and normalisation of monetary policy

Mohamed El-Erian was chief economist at the world's biggest bond fund, and has a very clear perspective. This article looks briefly at key economic indicators, and puts policy moves up against the main arguments/views that consider the recent hikes as good or bad - an excellent analysis tool for essays - I've highlighted the first for you:


No, Fed Didn't Make A Mistake By Hiking Rates

|
by: Mohamed El-Erian
A report adds to the growing debate about the wisdom of monetary policy normalization.
By encouraging systemically important central banks to move forward with interest rate hikes, the Bank for International Settlements' well-written annual report will add fuel to the growing debate about the wisdom of the Federal Reserve's ongoing process of monetary policy normalization. This discussion boils down to a judgment on four key issues on which there are quite a few divisions, including within the central banking community.

Some have already argued that, having hiked for a second time this year and signaled its intention for another rate rise in the second half of 2017, the Fed is making a policy mistake that risks choking economic growth. Others, including the BIS, welcome the central bank's willingness to gradually move away from too many years of exceptional monetary stimulus, financial volatility repression and ample support for asset prices.

Where you come out on this debate depends primarily on the absolute and relative weights you ascribe to four main factors -- all of which are subject to genuine analytical uncertainty.

1. Labor market slack: The U.S. economy has been one of the world's most powerful engines of employment creation in recent years, adding almost 17 million jobs since the depth of the recession. In the process, the unemployment rate has fallen to 4.3 percent, a level that not so long ago was deemed beyond "full employment."

But not all indicators of the labor market are healthy. Wage increases have been rather muted, and notably lower than what would have been expected given realized job creation and the unemployment rate. Meanwhile, and also contrary to traditional model-based expectations, the labor participation rate declined by 0.2 percentage points last month to 62.7 percent, a historically low level.

While this combination leads to different views on the extent of remaining slack in the labor market, it is perhaps the least controversial of the four factors. A notable majority of analysts seems to agree that the U.S. economy is near, if not at, full employment, and that much of the remaining labor market challenges now have an important structural component that monetary policy cannot effectively address.

2. Prospects for inflation: Unlike the employment target, the Fed has struggled to meet the second objective of its dual mandate -- the 2 percent inflation target. Moreover, the central bank's preferred inflation gauge, the PCE, has declined in recent months to about 1.5 percent rather than converge to the target, and inflationary expectations, as measured by the market for Treasury Inflation Protected Securities, have also fallen. With that, there is a wide range of views, including within the Fed, as to what lies ahead.

Some view the recent inflation decline as both temporary and reversible, arguing that it is just a matter of time until the 2 percent target is reached. As such, they are inclined to "look through" the recent data. Others feel that the recent fall in inflation may be a sign of larger problems looming, thus requiring the Fed to temper its process of monetary policy normalization. A third group questions the information content of the published inflation data, noting that they are subject to mis-signaling on account of partial measurements and structural changes (examples include what is happening to mobile phone bills, as cited by Fed Chair Janet Yellen).

3. Risks to future financial stability: The dispersion in the range of views becomes even wider when it comes to the Fed's influence on future financial stability.

Despite evidence that bouts of large financial instability can undermine the attainment of the Fed's twin employment and inflation objectives -- a point that was reiterated by New York Fed President Bill Dudley in Switzerland on Monday -- some still ignore this factor in assessing the appropriate monetary policy response. This is unfortunate. But it doesn't mean that there is agreement among those who do incorporate financial stability in their policy calculus.

Some worry that the prolonged period of ultra-loose monetary policy has not just decoupled asset prices from fundamentals, but also conditioned traders and investors to take excessive risks on the belief that central banks will always cover their backs. Others question the extent to which the Fed has "goosed" asset prices.

4. Recovering from a policy mistake: The final area of major disagreement relates to the realm of "what if" -- and, in particular, what if the Fed ends up making an inadvertent policy mistake.
The conventional view is that it is easier for the Fed to recover from the error of being too loose than being too tight. But the cost-benefit analysis changes if one of the consequences of being too loose is a bubble in financial markets that then takes on its own unsettling dynamics (the ultimate example being the 2008 financial crisis that almost tipped the U.S. and the global economy into a multiyear depression).

Given the uncertainties surrounding these four factors -- both on a standalone basis and in terms of their interaction -- we should not be surprised at the extent of disagreement that currently exits.
The extent of fluidity in recent years, including the growing list of improbables that have become reality, means that policy conclusions are now more a question of judgment than the result of rigorous analytical models.

This situation requires the Fed to pursue a delicate and cautious mix of transparency, predictability and responsiveness. It must do so while continuing to urge Congress and the administration to accelerate the policy hand-off from excessive reliance on unconventional monetary measures to a more comprehensive policy response that includes pro-growth structural reforms, more responsive fiscal policy, very targeted debt reduction and greater efforts at global policy coordination.

Put me in the camp of those who, when assessing the balance among the four cited factors, feel that the Fed's June interest rate hike was not a policy mistake, that another hike in the remainder of 2017 is warranted based on current indicators, and that policy makers should take seriously the growing risk of future financial instability, especially in the absence of a careful normalization.
This article originally appeared on Bloomberg View.

Wednesday 28 June 2017

Supply-side - Tourism VAT

You may or may not know that a campaign is running to persuade the government to boost tourism by cutting tourism VAT. The requirement to come to an agreement with the DUP to support the government has moved this forward. Look at the figures, they are not small! However, can we be sure they are accurate?

BREAKING NEWS!
 
Tourism VAT is on the agenda for the Government as part of the Confidence and Supply arrangement agreed by the Conservative Party and the Democratic Unionist Party of Northern Ireland. 

As set out in the agreement, made public yesterday:
A detailed consultative report will be commissioned into the impact of VAT on tourism in Northern Ireland to recommend how best to build upon the growing success of that sector
This comes after the DUP made a reduction in Tourism VAT a manifesto pledge.

We think this is a good start and that a detailed study into a Tourism VAT cut for Northern Ireland, which competes with Ireland for custom where the rate is just 9%, will show that a reduction in Tourism VAT should be implemented across the UK. 


Speaking about the news, our Campaign Chairman, Dermot King said yesterday:

 
"The benefits would be felt most keenly in coastal and rural areas in need of regeneration.  We look forward to submitting our extensive research to the government outlining the positive impacts of a reduction.”

I am confident the findings of this consultation will show that Tourism VAT should be reduced to 5% across every part of the UK, creating 121,000 jobs, increasing UK export earnings from tourism and bringing in £4.6bn to the Treasury over 10 years."
 
The Campaign to Cut Tourism VAT will input into the consultation on your behalf and keep you updated as the consultation progresses.
Encouraging your MP to support Cut Tourism VAT

The Campaign has support from politicians of all political parties. We currently have the support of 120 MPs. Please check this list to see if your MP already support us and if not, do contact them asking them to join up.

You could use our new Financial Highlights document which sets out all the compelling reasons for reducing Tourism VAT in an easy to read format. 
If you'd like to discuss this further or get in contact with the campaign, please email Chris@Cuttourismvat.co.uk

Learn more about disruption


Car sharing or ride hailing is set to become a huge industry during the next two decades.
Disruption has become the investors’ worst enemy over the past few years. Thanks to advances in technology, disruptive technologies are now gaining traction faster than ever, and venture capitalists are throwing money at start-ups, which is only accelerating the trend. Almost no industry is immune from disruption and the bottomless pockets of seed investors. The auto industry, which has been historically dominated by just a few players thanks to the industry’s high barriers to entry, is an excellent example of how technology is breaking down barriers to increase competition, innovation, and variety for consumers.

According to a new research report from Bank of America on the auto sector, over 1700 start-ups are currently trying to disrupt the automotive industry, and while most of these start-ups will likely fail, the ones that succeed could result in a tectonic shift across the industry.

Ride Hailing And Car Sharing Could Reduce Auto Sales By 436 Million Units

According to independent surveys, one car sharing vehicle can remove or suppress 7 to 25 privately owned vehicles. One ride hailing vehicle can remove an estimated 5 to 10 vehicles from the road. With over $35 billion invested in ride hailing start-ups cumulatively, it’s clear that this one industry is going to be a huge thorn in the side of automakers. Even though the industry’s premier companies Uber and Lyft, reported combined losses of $4 billion in 2016, the disruptive impact they’ve already had on the market looks set to be here to stay.


Two detailed recent customer surveys from the University of Berkeley (TSRC) in the US and Carplus in the UK demonstrate the direct impact carsharing has on reducing privately owned vehicles. The findings show that 3% of one-way car sharing members sold a car and didn’t replace it, compared to 14% of station based car sharing customers. Further, 9% of members claimed to defer purchase of a car due to one way car sharing, with 34% of station based car shares giving the same reason.

Overall, this data implies that one car sharing vehicle has the potential to directly remove 7 cars from the road through members selling their vehicles, and suppress a further 18 vehicle sales. Evidence of this trend is not just limited to UK consumers. In the US, a recent survey by Ipsos / Reuters (May 2017) showed that of those selling a car, 63% went on to buy another vehicle the 9% said they were selling their car to be reliant on using ride hailing services and a further 9% stated that they were becoming reliant on other forms of mobility services (public transport or cycling).


By extrapolating these trends, Bank of America’s analysts calculate that the current behavior change for ride hailing and car sharing services could lead to a foregone growth in the vehicle parc (population) of 158 to 436 million vehicles by 2030, that’s 158 to 436 million fewer vehicles sold by the major auto manufacturers.


It’s not just auto producers that will suffer. Along with the reduced number of vehicles required, the number of miles traveled in vehicles will also reduce. According to the TSRC report, as highlighted in Bank of America’s report, the net reduction in miles traveled per ride hailing and car share customer declined by an average of 610 miles per year when faced with the marginal pay per trip cost.

Aggregating of this reduction in vehicle miles traveled across the whole user base of vehicle sharing indicates a reduced vehicle mileage 45,000 miles a year. Aggregated and extrapolated through 2030, this trend could see a net reduction of 1.4 trillion miles per year traveled, a 9.5% reduction in vehicle miles traveled per year when considering the growing car population. All in all, Bank of America estimates this reduction in miles traveled could cost the entire auto value chain $1.4 trillion in revenue every year (using an estimated dollar per mile average).

Wednesday 21 June 2017

Patent levels and economic growth - a lesson from history

Skim read the first section; not the four points that are highlighted - these can be distilled into a very short sentence and will work in macro essays (hint: might come in handy for the exam...) - and note the point about resisting disruption (slavery). The article is not long, but this sort of material really gives the sort of background that demonstrates wider reading clearly to the examiner:

How to Boost Patents

June 20, 2017
The rate of meaningful innovation appears to have slowed, with negative consequences for economic growth and living standards. To try to understand these changes and why they are happening, it is worth learning from past episodes when American innovation was in the ascendancy, a key driver helping America become the most powerful economy in the world.

What factors were conducive to patenting in this period? How was the rate of patenting related to growth and mobility? In the past, invention was an important mechanism for social mobility.

A recent working paper provides some estimates for how important invention and patenting were over the course of a century. Ufuk Akcigit and John Grigsby of the University of Chicago and Tom Nicholas of Harvard University use a new dataset linking millions of patent records to Census data and state and county-level economic data. These linkages allow them to provide some new insight into why some states seemed more innovative using patents as a proxy over this golden age, and to try to quantify the effect.

When it comes to fostering an environment that encourages invention and patent activity, the stakes for states are high. Even though inventors accounted for just 0.02 percent of the population they had a substantial effect on their surroundings.

The authors find a strong positive relationship between patent activity and GDP growth at the state level. They predict that a state with four times as many patents as a less innovative state would become 30 percent richer in terms of GDP per capita from 1900 to 2000. This is roughly equivalent to the gap between the United States and New Zealand.


Source: Ufuk Akcigit, John Grigsby, and Tom Nicholas, “The Rise of American Ingenuity: Innovation and Inventors of the Golden Age,” National Bureau of Economic Research, 2017.
The authors analyze what factors influenced the level of inventive activity over this period, identifying four major factors:

1. Population density: a higher degree of urbanization tended to have more innovation. Clusters of people and ideas interacting were conducive to higher levels of inventiveness.

2. Strong capital markets: a higher level of bank deposits per capita, indicating a more stable, robust banking system, was associated with higher levels of patent production. Access to capital is important for inventors trying to develop their ideas and bring them to market.

3. Access to other geographical regions: the size of the market inventors could reach was important, both for the exchange of ideas and to sell their products. Stateswith a high cost of shipping goods out of state by road, rail, or waterways, were more geographically isolated and tended to have lower levels of patent activity.

4. Openness to new ideas: using a measure of families that owned slaves as a proxy for being averse to potentially disruptive ideas, they found a strong negative relationship between a legacy of slavery and patent activity.

These state-level factors matter because the authors find evidence that inventors were more likely to move from their home states and that they tended to move to states with an environment friendly to inventiveness and patent activity.

The degree of patent activity did not just matter for aggregate measures like economic growth, but on the personal level as well. The number of patents filed in a state was positively correlated with higher social mobility as measured by fraction of people with a high-skill occupation who had a low-skill father. Inventiveness has been an important source of competition and a channel of social mobility in America’s history.


Source: Ufuk Akcigit, John Grigsby, and Tom Nicholas, “The Rise of American Ingenuity: Innovation and Inventors of the Golden Age,” National Bureau of Economic Research, 2017.

Granted, the framework of innovation was much different in the golden age than it is now. When Thomas Edison and Nikola Tesla were embroiled in their arms race of ingenuity, most inventors operated outside firms either independently or in research laboratories. The authors find that the share of patents assigned to corporations rose from less than 10 percent in 1880 to almost 80 percent by 2000.

The relationship between location of the inventor and patent activity is also less straightforward. The share of U.S. patents granted to companies of foreign origin has been increasing over time, so it is possible the local factors might not matter as much as they did in the past.

Patents only account for one form of innovation. There are also trademarks, trade secrets, and copyrights. The United States has been more innovative in the latter three. As such, studies focusing on patent activity could underestimate the true level of innovative activity in some instances. 

The nature of invention and patent activity has changed, but the factors identified in this paper are still important. Access to markets, ideas, and capital give inventors the tools they need. Openness to new ideas allows their innovations to flourish. Creating an environment conducive to innovation (using patent activity as a proxy) is important for bolstering economic growth and upward social mobility.

Policymakers searching for ways to reignite American ingenuity would do well to heed the lessons from the country’s golden age of innovation.

Charles Hughes is a policy analyst at the Manhattan Institute. Follow him on  twitter @CharlesHHughes

Tuesday 20 June 2017

How manufacturing is innovating.

How to put the horsepower back into UK manufacturing 

The Times

Chris Greaves strolls the circular concourse of Factory 2050 in Sheffield. He may be the site’s operations manager, but even he seems wowed by the gear on display. Production lines magically reconfigure their shapes for the next part coming through. Hulking robotic arms operate with human hair-level accuracy. Artificial intelligence-powered workbenches gather data to make processes more efficient, while augmented-reality headsets harness computer-aided design data to let wearers to see through walls.

“This is cool,” says Mr Greaves, as a sturdy metal omniMove platform trundles past on eight autonomous wheels, beeping as it carries itself off on some undeclared errand. “You’re starting to see these technologies coming through, showing people the art of the possible. This isn’t the future any more. It’s not Tomorrow’s World, it’s happening now.”


Yet this is not only a showroom for industrial toys. Factory 2050 is the biggest and best collaborative research and development (R&D) facility at the Advanced Manufacturing Research Centre, part of the University of Sheffield. It is shaped like a vast upended glass turbine — an apt layout, it turns out, as the breakthroughs being explored at the facility may inject some much-needed horsepower back into UK manufacturing.

When it comes to productivity, the UK lags woefully behind the competition. Output per hour is 16 per cent below the G7 average, and rival nations are rushing headlong into the “fourth industrial revolution”, where traditional manufacturing is bolstered by the latest digital and data-harvesting technology.It is vital that the UK catches up. 

Factory 2050 has been set up as a blank canvas for R&D among its member businesses, which can come with a project, stating a target production rate and stipulating critical features. The facility then pulls together the best technology and, if necessary, adapts it.

Mr Greaves shows off a robotic apparatus developed for BAE Systems, the defence and aerospace company, which countersinks holes in aircraft fuselage and wing sections. Robotics brought the projected cycle time down from 50 to 18 seconds. For Rolls-Royce, the car and aero-engine company, the centre developed a tool that shaved 75 per cent off its production process time.       

The centre has done similar work for McLaren, Boeing and Jaguar Land Rover. This is all well and good for these industrial giants, yet even the big guns understand that such gains don’t help if the technology and its data-gathering potential are not being shared.

Ian Davis, the chairman of Rolls-Royce and a member of the Productivity Leadership Group, says: “A lot of the evidence around the productivity problem suggests it’s especially acute for small and medium-sized enterprises (SMEs), which are by far the biggest part of the economy.”

Factory 2050 has extended its membership to smaller local businesses. The Accrington-based Cardboard Box Company felt its costly German presses were running at only 70 per cent capacity because the team could not pick the boxes fast enough, without risking repetitive strain and back injuries. Factory 2050 is developing robotics to cope with cardboard. Ken Shackleton, the managing director of the Cardboard Box Company, says: “If it costs £50,000 to £60,000, we can justify it as an investment.”

Forty per cent of applications developed at Factory 2050 are for SMEs, but some technology remains out of reach. Take the Kuka Titan, a six-axis robotic arm with a 3m reach that the facility is tweaking to provide a more flexible, cost-effective alternative to traditional machine tools. It is a beast.Mr Greaves is warned by another team member not to get too close. “It’s a big dangerous arm,” he says, “and it won’t know that it’s squished you.”

Health and safety may protect against physical harm, but if there is one thing that drives resistance to such technology it is the impact it may have on people’s working lives. Many fear the big arm is coming to take their job.So far, that fear seems unfounded. As much as possible, advanced manufacturing, artificial intelligence and robotics are being developed to work with humans, rather than replace them. 

Augmented-reality headsets overlay data on to workspaces to reduce errors, increase speed and foster remote collaboration. The cobot, or collaborative robot, is fitted with torque vector sensors that enable it to work with more dextrous humans, without the risk of harm.This isn’t the future any more. 

It’s not Tomorrow’s World, it’s happening now

While the latest breakthroughs may be impressive, they can go only so far in tackling the country’s productivity issue; these days manufacturing accounts for only about 8 per cent of the UK’s GDP.

 Given that the problem extends across all sectors, Rolls-Royce, BAE and their like are serious about the potential impact of soft skills and leadership techniques.

Mr Davis says: “The human side, getting the best out of people, has an even bigger role in improving productivity than technology does. It’s all linked, but talent management, diverse recruitment and the motivation of people are all big drivers of productivity.”

Again, such development will prove an easier investment for large multinationals than for SMEs. Rolls-Royce and BAE are among the companies helping their smaller partners directly. They work with Lancaster University Management School to train SMEs in understanding the link between employee engagement, working practices and productivity.

At BAE, apprentice and graduate schemes are having an effect on smaller businesses. Sir Roger Carr, the chairman of BAE and a member of the Productivity Leadership Group, says: “Many of these young people wind up working in supply chain companies, which then spreads best practice and techniques.”These youngsters are entering a fast-changing business landscape, but they are not the only ones who are likely to feel the pressure. 

Sir Roger says: “This touches everybody. The focus on productivity will be absolutely critical in the challenging next phase of business life, and can’t be a background activity. It has to be a foreground mission."

Technology education is key - Sir James Dyson

Sir James Dyson: Technology education will be key to bridging our skills gap

A serious crisis is looming: Britain will be short of 1.8 million engineers by 2025. This is not going to be solved through apprenticeship schemes or the traditional approach that is focused on university education. Neither will the indiscriminate imposition of a tax on business, to fund specific apprenticeship schemes, solve the problem.

Apprenticeships have, wrongly, been seen as the main solution to the so-called skills shortage. While they are important for some businesses, they do not address the core problem. Nor, it seems, can traditional education adequately nurture the inventive minds that fast-paced engineering companies so desperately need.

For Dyson and most modern, high-tech businesses, the critical shortage is of highly skilled engineers, scientists, mathematicians and coders. We need the sharpest graduates, with an approach to problem-solving that allows them to conceive new technologies. These are the brains that will help us to generate the algorithms, software, hardware and intellectual property that we need to stand a chance at exporting. The success of Singapore shows the benefits of a focus on technology education, a high-value economy and exports. There, 40 per cent of graduates are engineers and it is a brilliant place to develop technology.

The Dyson Institute of Engineering and Technology will provide two and a half times the learning time of a conventional university

Yet a consultation in the UK, by the science and technology select committee in 2016, listed potential solutions to plug our skills gap as “apprenticeships, vocational courses, mentoring, teacher placements in industry and establishing links between business and schools/colleges”. These are laudable in their own way, but are in danger of proving irrelevant. It is notable that there was not a university-level qualification in sight. 

In short, if the education system is to meet the needs of technology companies such as Dyson, and allow the UK to stand a chance of fighting its way to the front of the world stage in this technology-dominated age, then our approach to education needs a shake-up.Thankfully, Jo Johnson grasped the scale of the problem and delivered the Higher Education and Research Bill during the last parliament. 

This legislation recognises that it is companies that are investing in and shaping the future. It asserts that they are best placed to look forwards and help to provide young people with the level of education they need.In September we open the Dyson Institute of Engineering and Technology to our first cohort. We will provide a Russell Group-level degree alongside a real-world job — we will pay them a salary and charge no tuition fees. 

It is a different approach, but represents a highly relevant alternative to a traditional education.The undergraduates will be “proper” Dyson engineers and scientists from day one. They will work with leading practitioners on real products, for real homes. They will do this alongside their studies. They will receive two and a half times the learning time of a conventional university. They will be at our university 47 weeks a year; double the 24 weeks at Oxford and Cambridge, for four years rather than three.

The legislation represents an opportunity to produce graduates aligned to our economic needs, by allowing them to learn from real practitioners. It is tremendously exciting: an enticing carrot, incentivising businesses to get on board and generate the high-technology undergraduates to fill the shortage we’re all bemoaning.

Unfortunately, we’re still being beaten with a big stick; the apprenticeship levy is set to be another tax on businesses. This blunt instrument is forcing businesses into a corner, demanding that all businesses pay a tax to fund the skills that only a few need.

Let me be clear. Apprenticeships have a valuable place in certain industries, but we need hardware and software engineers, and scientists, to develop technology. Degree-level education is the real battleground. We can have a transformational impact on our education system and our economy, at no cost to the state or the undergraduates, but policymakers need to give us the flexibility to achieve this.

Sunday 18 June 2017

How timely - analysis of credit cycles & turning points

I have stripped out some of the newsletter (the preamble) to allow you to focus on the core "Minsky" point. If you understand this much of the ebb and flow of economies will become much clearer. You can subscribe to this free newsletter here. I cannot believe how lucky you are to cover this point in class, then have the detail fleshed out in an easy-to-read newsletter (again!). I suggest you read the letter from start to finish, re-reading key points to clarify & embed them. This is the shift to A*, and if it happens before the exam, you'll understand why:

The Next Minsky Moment
Economics has its overused themes and phrases, too. One is “Minsky moment,” the point at which excess debt sparks a financial crisis. The late Hyman Minsky said that such moments arise naturally when a long period of stability and complacency eventually leads to the buildup of excess debt and overleveraging. At some point the branch breaks, and gravity takes over. It can happen quickly, too.
Minsky studied under Schumpeter and was clearly influenced by many of the classical economists. But he must be given credit for formalizing what were only suggestions or incomplete ideas and turning them into powerful economic themes. I’ve often felt that Minsky did not get the credit he deserved. I look at some of the piddling ideas that earn Nobel prizes in economics and compare them to the importance of Minsky’s work, and I get an inkling of the political nature of economics prizes.
Minsky’s model of the credit system, which he dubbed the “financial instability hypothesis” (FIH), incorporated many ideas already circulated by John Stuart Mill, Alfred Marshall, Knut Wicksell and Irving Fisher. “A fundamental characteristic of our economy,” Minsky wrote in 1974, “is that the financial system swings between robustness and fragility, and these swings are an integral part of the process that generates business cycles.” [Wikipedia]
Minsky came to mind because in the past week I saw yet more signs that financial markets are overvalued and investors excessively optimistic. Yet I still haven’t seen many references to Minsky. That’s a little surprising.
On reflection, I realized I hadn’t mentioned Minsky lately, either. That is a potentially dangerous oversight, because we forget his fundamental insights at our peril. Last week’s brief technology tumble should have been a wake-up call. So today we’ll have a little Minsky refresher and look at some recent danger signs. And I predict that we will soon see Minsky mentions popping up everywhere.
Natural Instability
Hyman Minsky, who passed away in 1996, spent most of his academic career studying financial crises. He wanted to know what caused them and what triggered them. His research all led up to his Financial Instability Hypothesis. He thought crises had a lot to do with debt. Minsky wasn’t against all debt, though. He separated it into three categories.
The safest kind of debt Minsky called “hedge financing.” For example, a business borrows to increase production capacity and uses a reasonable part of its current cash flow to repay the interest and principal. The debt is not risk-free, but failures generally have only limited consequences.
Minsky’s second and riskier category is “speculative financing.” The difference between speculative and hedge debt is that the holder of speculative debt uses current cash flow to pay interest but assumes it will be able to roll over the principal and repay it later. Sometimes that works out. Borrowers can play the game for years and finally repay speculative debt. But it’s one of those arrangements that tends to work well until it doesn’t.
It’s the third kind of debt that Minsky said was most dangerous: Ponzi financing is where borrowers lack the cash flow to cover either interest or principal. Their plan, if you can call it that, is to flip the underlying asset at a higher price, repay the debt, and book a profit.
Ponzi financing can work. Sometimes people have good timing (or just good luck) and buy a leveraged asset before it tops out. The housing bull market of 2003–07, when people with almost no credit were buying and flipping houses and making money, attracted more and more people and created a soaring market. The phenomenon fed on itself. Bull markets in houses, stocks, or anything else can go higher and persist longer than we skeptics think is possible. That is what makes them so dangerous.
Minsky’s unique contribution here is the sequencing of events. Protracted stable periods where hedge financing works encourage both borrowers and lenders to take more risk. Eventually once-prudent practices give way to Ponzi schemes. At some point, asset values stop going up. They don’t have to fall, mind you, just stop rising. That’s when crisis hits.
The Economist described this process well in a 2016 Minsky profile article. (Emphasis mine.)
Economies dominated by hedge financing – that is, those with strong cashflows and low debt levels – are the most stable. When speculative and, especially, Ponzi financing come to the fore, financial systems are more vulnerable. If asset values start to fall, either because of monetary tightening or some external shock, the most overstretched firms will be forced to sell their positions. This further undermines asset values, causing pain for even more firms. They could avoid this trouble by restricting themselves to hedge financing. But over time, particularly when the economy is in fine fettle, the temptation to take on debt is irresistible. When growth looks assured, why not borrow more? Banks add to the dynamic, lowering their credit standards the longer booms last. If defaults are minimal, why not lend more? Minsky’s conclusion was unsettling. Economic stability breeds instability. Periods of prosperity give way to financial fragility.
Minsky’s conclusions are indeed unsettling. He called into question the belief that markets, left to operate unimpeded, will deliver stability and prosperity to all. Minsky thought the opposite. Markets are not efficient at all, and the result is an occasional financial crisis.
Complacency in the midst of a wanton debt buildup was beautifully expressed in a remark by Citigroup Chairman Chuck Prince in 2007:
The Citigroup chief executive told the Financial Times that the party would end at some point, but there was so much liquidity it would not be disrupted by the turmoil in the US subprime mortgage market.
He denied that Citigroup, one of the biggest providers of finance to private equity deals, was pulling back.
“When the music stops, in terms of liquidity, things will be complicated. But as long as the music is playing, you’ve got to get up and dance. We’re still dancing.” [source]
Minsky wasn’t around to see the 2008 crisis that fit right into his theory. Paul McCulley attached Minsky’s name to it, though, and now we refer to these crises as “Minsky moments.”
Are we closing in on one now?
Learning the Rules
As I mentioned, technology stocks suffered from a little anxiety attack in the markets last week. It didn’t not last long and really wasn’t all that serious. (Yet.) It was nothing worse than what everyone called “normal volatility” ten years ago. But the lack of concern it generated this time is not bullish, in my view. More than a few investors seem to think that “nowhere but up” is somehow normal.
Doug Kass had similar thoughts (there’s that Zeitgeist trope thing again) and reminded us all of Bob Farrell’s famous Ten Rules of Investing. You could write a book about each one of them. I’ll just list them quickly, then apply some of them to our current situation. (Emphasis mine.)
1. Markets tend to return to the mean over time.
2. Excesses in one direction will lead to an opposite excess in the other direction.
3. There are no new eras – excesses are never permanent.
4. Exponential rapidly rising or falling markets usually go further than you think, but they do not correct by going sideways.
5. The public buys most at the top and the least at the bottom.
6. Fear and greed are stronger than long-term resolve.
7. Markets are strongest when they are broad and weakest when they narrow to a handful of blue-chip names. (Sound familiar? Can you say FAANGs?)
8. Bear markets have three stages: sharp down, reflexive rebound, and a drawn-out fundamental downtrend.
9. When all the experts and forecasts agree, something else is going to happen.
10. Bull markets are more fun than bear markets.
I think most of these rules are obvious to investors who experienced the 2008 mess, the dot-com crash, and (if you’re of a certain age) the 1987 Black Monday. Some of us can remember 1980 and ’82. ’82 was especially ugly. (I had just gotten my master of divinity degree, and all I knew was that the job market sucked.) Maybe we mostly forget these experiences, but hopefully we pick up a little wisdom along the way. The problem is that now a new generation of investors lacks this perspective. They had little or no stock exposure in 2008 and experienced the Great Recession as more of a job-loss or housing crisis than a stock market crisis.
Of course, the previous crises are no secret. People know about them, and on some level they know the bear will come prowling around again, eventually. But knowing history isn’t the same as living through it. Newer investors may not notice the signs of a top as readily as do investors who have seen those signs before – and who maybe got punished for ignoring them at the time.
Doug Kass notices. Here’s a bit from an e-mail conversation we had last week.
During the dot.com boom in 1997 to early 2000 there was the promise (and dream) of a new paradigm and concentration of performance in a select universe of stocks. The Nasdaq subsequently dropped by about 85% over the next few years.
I got to thinking how many conditions that existed back then exist today – most importantly, like in 1999, when there emerged the untimely notion of “The Long Boom” in Wired magazine. It was a new paradigm of a likely extended period of uninterrupted economic prosperity and became an accepted investment feature and concept in support of higher stock prices!
[JM note: Here’s the Wired article Doug mentions: “The Long Boom: A History of the Future, 1980-2020.”]
And in 2007 new-fangled financial weapons of mass destruction – such as subprime mortgages that were sliced and diced during a worldwide stretch for yield – were seen as safe by all but a few.
And, just like during those previous periods of speculative excesses, many of the same strategists, commentators, and money managers who failed to warn us then are now ignoring/dismissing (their favorite phrase is that the “macroeconomic backdrop is benign”) the large systemic risks that arguably have contributed to an overvalued and over-loved U.S. stock market.
Doug points especially to Farrell’s Rule 7, on market breadth. A rally led by a few intensely popular, must-own stocks is much less sustainable than one that lifts all boats. We see it right now in the swelling interest in FAANG (Facebook, Apple, Amazon, Netflix, Google). Tesla comes to mind, too. Their influence on the cap-weighted indexes is undeniably distorting the market. These situations rarely end well.
Chinese Minsky
What is behind these distortions? Ultimately, it’s about capital flows. Asset prices rise when demand outstrips supply, which is what happens when stocks or real estate or whatever are perceived as more rewarding than cash. Those with the most unwanted cash compete with each other to buy the alternatives.
The Fed and other developed-country central banks created a lot of liquidity in recent years, so that’s undoubtedly a factor. An even greater one may be China, though.
Consider China’s explosive growth. Its proximate cause is US demand and, to a lesser extent, European demand for Chinese exports. We sent them our dollars and euros; they sent us widgets and doodads. US dollars inside China are undesirable to wealthy Chinese and the Chinese government, so they send the dollars right back to us in exchange for other assets: homes, commercial real estate, stocks, Treasury bonds, entire companies.
Meanwhile, within China, the government aggressively encourages lending for projects a free economy would never produce. Let me make a critical point here: While the central bank of China is not doing much in the way of quantitative easing, the government’s use of bank lending gone wild is essentially the same thing. The banks have created multiple trillions of yuan every year for many years. If you add Chinese bank lending statistics to the quantitative easing statistics of the world’s major central banks, the number is staggering. I think it’s entirely appropriate to perform that calculation.
Beijing thinks this massive bank lending is useful in keeping the population happy, employed, and satisfied with their government. It has worked pretty well, too. It can’t work indefinitely, but the government seems bent on trying. Consider this June 14 Wall Street Journal report.
While Beijing is carrying out a high-profile campaign to reduce leverage in its financial markets with one hand, with the other it is encouraging more potentially reckless borrowing. This week, the regulator put pressure on the country’s big banks to lend more to small companies and farmers, while the government announced tax breaks for financial institutions that lend to rural households. That follows recent guidance that banks should set up “inclusive finance” units.
If the goal of lending to poorer customers sounds noble, the concern is that the execution will only worsen Chinese banks’ existing problems, namely high levels of bad loans and swaths of mispriced credit. Bank lending to small companies is already growing pretty fast, with non-trivial sums involved: It jumped 17% in the year through March to 27.8 trillion yuan ($4.084 trillion). That compares favorably with the 7% rise in loans to large- and medium-size companies over the same period.
Observers like me have been saying for years that China’s banking system is overleveraged and will eventually collapse. We’ve been wrong so far. Beijing’s central planners may be Communists, but they use the capitalist toolbox to their advantage.
 China will eventually face a reckoning. When it does, the impact will spread far outside China. What do you think will happen when Chinese money stops buying Vancouver real estate and US stocks? The outcome won’t be bullish.
The Swiss National Bank Is Doing What?
Pity the poor Swiss government. They have run their country well and don’t have a great deal of debt. They are a small country of just 8 million people, but they make an outsized impact on economics and finance and money.
Because Switzerland is considered a safe haven and a well-run country, many people would like to hold large amounts of their assets in the Swiss franc. Which makes the Swiss franc intolerably strong for Swiss businesses and citizens. So the Swiss National Bank (SNB) has to print a great deal of money and use nonconventional means to hold down the value of their currency. Their overnight repo rate is -0.75%. That’s right, they charge you a little less than 1% a year just for the pleasure of letting your cash sit in a Swiss bank deposit.
And the SNB is buying massive quantities of dollars and euros, paid for by printing hundreds of billions in Swiss francs. The SNB owns about $80 billion in US stocks today (June, 2017) and a guesstimated $20 billion or so in European stocks (which guess comes from my friend Grant Williams, so I will go with it).
They have bought roughly $17 billion worth of US stocks so far this year. They have no formula; they are just trying to manage their currency. Think about this for a moment: They have about $1000 in US stocks on their books for every man, woman, and child in Switzerland, not to mention who knows how much in other assorted assets, all in the effort to keep a lid on what is still one of the most expensive currencies in the world. I gasp at prices every time I go to Switzerland. (I will be in Lugano for the first time this fall.)
Switzerland is now the eighth-largest public holder of US stocks. It has got to be one of the largest holders of Apple (see below). What happens when there is a bear market? Who bears the losses? Print just more money to make up the difference on the balance sheet? Do we even care what the Swiss National Bank balance sheet looks like? More importantly, do they really care? We all remember European Central Bank President Mario Draghi’s famous remark, that he would do “whatever it takes” to defend the euro. We could hear the Swiss singing from the same hymnbook, by and by.
The point is that central banks and governments all the world are flooding the market with liquidity, which is showing up in the private asset markets, in stock and housing and real estate and bond prices, creating an unquenchable desire for what appear to be cheap but are actually overvalued assets – which is what creates a Minsky moment.
Now, remember what Minsky said. When an economy reaches the Ponzi-financing stage, it becomes extremely sensitive to asset prices. Any downturn or even an extended flat period can trigger a crisis.
While we have many domestic issues that could act as that trigger, I see a high likelihood that the next Minsky moment will propagate from China or Europe. All the necessary excesses and transmission channels are in place. The hard part, of course, is the timing. The Happy Daze can linger far longer than any of us anticipate. Then again, some seemingly insignificant event in Europe or China – an Austrian Archduke’s being assassinated, or what have you – can cause the world to unravel.
It’s a funny world. We have our rashes of zombie movies and 20 people in all corners of the planet inventing the same thing at the same time. And we have our central banks and governments exhibiting unmistakable herd behavior and continuing to do the same foolish things over and over. They never really intend to have the crisis that ensues.
 Remember Farrell’s Rule 3: There are no new eras. The world changes, but danger remains. Gravity always wins eventually. It will win this time, too. And when it does, we will begin undergo the Great Reset.

Thursday 15 June 2017

Must-read post on productivity & GDP potential

From John Mauldin's Outside The Box series. This is something you really should take the time to assimilate, as it brings together many disparate strands we have been discussing through Year 13:

Productivity: A Surprise Upside Risk to the Global Economy?
A bottom-up look at major industries around the world reveals significant potential for productivity growth.
By Matthew Tracey, Joachim Fels 
May 2017
Is productivity dead? It is no secret that global productivity has languished in the post-financial-crisis years – with precious little evidence of a turnaround. If robust productivity growth were indeed a relic of the past, the long-term consequences for investors would be profound: Lower-for-even-longer interest rates would prolong the pain for yield-starved savers, pension funds and financial institutions; equity markets might underwhelm in a low-growth world; and PIMCO’s New Neutral might begin to look permanent.
But what if amidst all the doom and gloom there were a productivity-revival story in its infancy? That world would look starkly different. Imagine: World growth stages a comeback, interest rates normalize to the benefit of fixed income investors globally, and fears of secular stagnation give way to a renewed optimism in our future economic potential.
The productivity question couldn’t be more important. After all, there are only two ways to grow an economy: boost productivity, or grow the labor force (demographics). And we’re certainly not going to get much help from demographics. Fortunately, the upside potential for global productivity is growing (or, in economist-speak, productivity’s “right tail is getting fatter” – referring to the rising probability of a positive surprise in the range of outcomes). You might never recognize productivity’s upside potential, however, looking through the lens of macroeconomics alone. So let us look instead to microeconomics (sacré bleu!) for insights. Our thesis in a nutshell: Don’t rule out a global productivity rebound in the coming years that ushers in “old normal” (4%+) global growth. While a strong rebound is not PIMCO’s baseline view, it’s a tail that is fattening – and the microeconomic catalysts may have arrived.
Productivity optimists versus pessimists: clash of titans
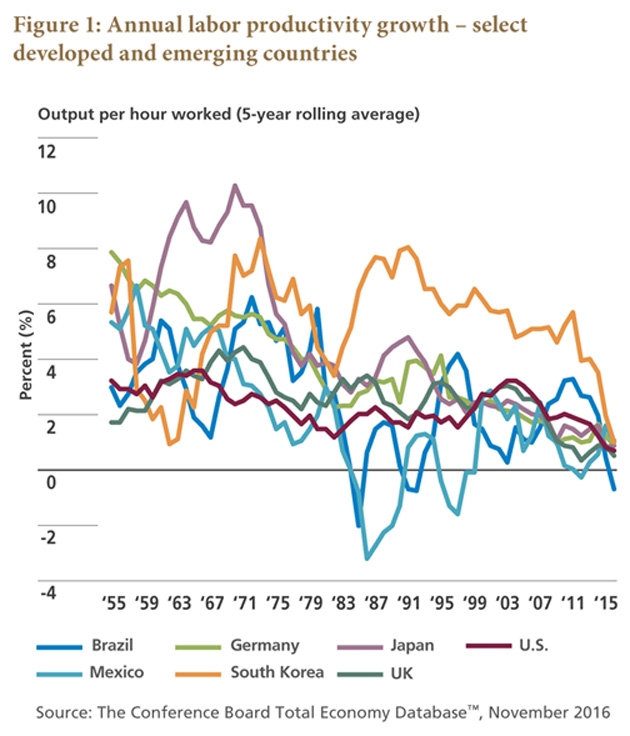
Labor productivity – or GDP per human hour worked – is in the dumps. Throughout the entire post-financial-crisis period we’ve observed declining productivity growth in economically significant countries worldwide (see Figure 1).
Productivity pessimists typically blame secular stagnation for the slump. Here, the arguments fall into two camps. “Demand-side” secular stagnation devotees, notably Larry Summers (a guest speaker at PIMCO’s upcoming Secular Forum), suggest that a chronic deficiency of aggregate demand and investment is responsible for the dismal productivity growth we’ve seen in recent years … and that absent a rebound in demand, we’re doomed to more of the same. Meanwhile, “supply-side” secular stagnationists such as Robert Gordon believe innovation today isn’t what it used to be and that productivity gains from the computer revolution (formally, the “information and communications technology” or “ICT” revolution) have mostly run their course. Thes e supply-side pessimists argue that today’s innovations are mostly non-market – namely they help us enjoy our leisure time, but that’s about it (think iPhones loaded with fancy new apps). Gordon himself has suggested that “The future of technology can be forecast 50 or even 100 years in advance” and that he sees nothing on the horizon that will rival the breakthroughs of the past (see references list at the end of this paper – Gordon 2014).
Yet it is hard to look around and not see promising new technologies everywhere: self-driving cars, drones buzzing overhead and “smart” everything, to name just a few. Enter the techno-optimists: people who argue we’re on the cusp of radical breakthroughs that will drive huge gains in productivity and living standards. In our increasingly knowledge-based economy, they suggest, we’re moving from a zero-sum game of trade in goods to a positive-sum game of trade in information and ideas – with exponential benefits that our brains are not wired to foresee. (If you want to become a techno-optimist, read “Abundance: The Future Is Better Than You Think,” by Peter Diamandis and Steven Kotler.)
And so the debate rages on. It is certainly true that many consumer inventions – Facebook, Fitbit, Apple Watch and the like – don’t help workers produce more output per hour on the job. But what if these same underlying technologies (big data, microsensors, ever-smaller computers) join forces in less obvious ways to revolutionize the way firms, and whole industries, operate? And, we ask, is the future actually as predictable as Gordon would have us believe? Legend holds that an 1876 internal memo from Western Union, the telegraph monopolist, read: “The telephone has too many shortcomings to be considered as a serious means of communication.” Well, we all saw how that turned out.
Bottom line: Rapid innovation – as Robert Solow might say – is everywhere except in the productivity statistics. So what gives? Macroeconomics may not have the answer. As Dr. Olivier Blanchard reminded us during our May 2016 Secular Forum, we macro folks actually know very little about productivity. So let us turn, instead, to microeconomics.
Microeconomics: a right-tail picture of global productivity
When we look at the state of industry in 2017 from the bottom up – sector trends down to company-level innovations – we see a global economy with underappreciated potential. A productivity-driven return to “old normal” 4%+ global GDP growth may lie within reach in the coming years, based only on the spread (“diffusion”) of existing technologies.
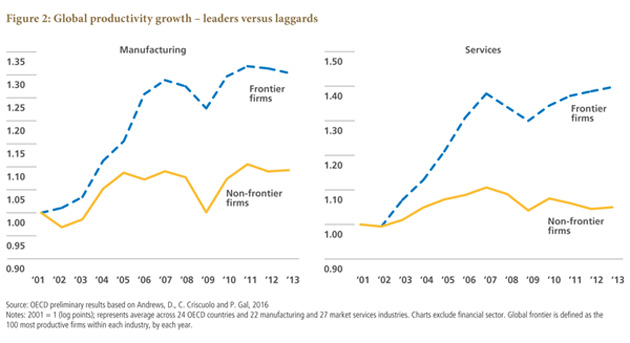
How? A handful of technologies have emerged that are radically changing the way firms do business. These technologies – offspring of the computer revolution – include artificial intelligence (advanced robotics), simulation, the cloud, additive manufacturing (3D printing), augmented reality, big data, microsensors and the “internet of things” (web connectivity of everyday objects). These technologies are now being used, in many cases for the first time, in synergy with one another. Together, they enable businesses to experiment more effectively, better measure their activities in real time, and scale their innovations – and those of their peers – faster. (See the works of Erik Brynjolfsson and Andrew McAfee for more.) Here’s the key: Smarter experimentation plus faster scalability of winning ideas can speed up the diffusion of best practices from productivity leaders to laggards. And global “catch-up” potential is huge, especially in emerging markets (EM). The productivity gap between leading, “frontier” firms and all others has widened dramatically in recent years – see Figure 2. (Note: This gap does not merely reflect productivity differentials across industries.) The gap cannot widen forever; inefficient and unproductive firms can play defense for a while – creative destruction takes time – but eventually they will converge toward the frontier or exit. This growing divergence between leaders and laggards represents strong pent-up productivity gains waiting for a catalyst (… read on!).
So there’s potential for catch-up … but why now?
Two logical questions: Haven’t computers, the internet and automation been around for years? Why should we expect a productivity rebound anytime soon? One key reason: cost. Productivity-enhancing technologies exist today that haven’t yet been put to use because their cost outweighs their perceived economic benefits. That’s changing.
Case study: advanced robotics
Take robotics. Costs continue to fall while performance improves – making automation more and more competitive with human labor. In many industries, companies are nearing an inflection point where they can earn an attractive return on an investment in advanced robotics systems (Sirkin et al., Boston Consulting Group 2015). “Generic” robotics systems capable of many different types of work cost, today, about $28 per hour, already below the typical hourly human wage in a number of industries. By 2020, the cost of advanced robotics is expected to fall to $20 per hour or lower – below the average human worker’s wage. The Boston Consulting Group projects that growth in global installations of advanced robotics systems will accelerate from 2%–3% per year today to about 10% per year over the next decade. The result: robust productivity gains in the industries that can take advantage.
Sound fanciful? This isn’t the stuff of theory or hope. A major German shoe manufacturer, for example, is building its first factory on German soil in 30 years; the 50,000-square-foot facility will rely on robots and customized automation to slash logistics and supply-chain costs – and free up hundreds of factory workers to focus on higher-skill tasks. And the world’s two biggest airplane makers also are incorporating advanced robotics into their production processes. To date, both companies have built planes mostly by hand. But going forward, taking after the auto industry, they will use robots, drones and higher-skill human labor to boost production efficiency – a response to years of order backlogs and surging (unmet) demand. Why now? Because these technologies are now priced low enough that they become accretive to earnings – and therefore are poised to transform these companies’ business models (Wall 2016).
And now smaller firms are joining in. Until recently, advanced robotic systems were too complex and too expensive for small firms – but it now generally takes only a few months for small- and medium-sized enterprises (SMEs) to earn a positive return on their investment in these technologies. Greater adoption by SMEs, most of which do not operate on the productivity frontier, will help speed up technological diffusion – a catalyst for faster aggregate productivity growth. (Note that SMEs account for about half of total employment in the United States.)
Pent-up productivity growth: examples from industry
Advanced robotics in shoe and airplane production is just the beginning. We may be approaching similar tipping points in other industries as well. McKinsey & Company, in a 2015 study authored by James Manyika and others, offered projections of global sector-level productivity growth potential through 2025 based on anticipated diffusion of known technologies and existing best practices. (Take the numbers themselves with a grain of salt; productivity trends are notoriously difficult to forecast.) Here are some of McKinsey’s industry-level estimates of potential annual productivity growth:
  • Agriculture: 4%–5%. Big data and cutting-edge microsensors can team up to create “precision agriculture” techniques that improve real-time forecasting, production tracking and micro-optimization of irrigation and fertilization. The result? Rising crop and meat yields – and less waste.
  • Automotive: 5%–6%. Big data, simulation and robotics can drive rapid improvements in operations – and force smaller manufacturers to merge, exit or adopt current best practices (the sector, globally, remains highly fragmented). Within parts supply, the industry’s largest segment by value added, advanced robotics may just be reaching the point of economic viability for second- and third-tier suppliers.
  • Food processing: 3%. Mechanization and automation can drive robust productivity gains, mainly in EM countries where food and beverage production is still relatively labor-intensive.
What about notoriously low-productivity service industries? Boosting productivity growth in services will be critical given these sectors’ rising share of global employment. Here, we see new hope for productivity gains through catch-up, consolidation, or exit – mainly due to the huge productivity gap between leaders and laggards (as shown previously in Figure 2). But again we ask: Why now? Greater use of computers, web technologies and analytics (the stuff manufacturers adopted long ago) is opening up services to greater competition – both domestically and internationally through global trade. (As evidence, consider that across countries, the value-added share of domestic services in gross exports has been increasing at a faster and faster clip as services become increasingly tradable. The “micro-multinationals” are coming.) Bottom line: In services, productivity gains through basic IT and digitization may still be in their infancy .
Now for a couple of service sector examples from McKinsey’s 2015 study. Below are their industry-level estimates of potential annual global productivity growth through 2025:
  • Healthcare: 2%–3%. Big data and simulation may produce gains through “smart” care, while basic IT improvements could drive time and cost savings. (Nurses, for instance, currently spend only one-third of their time on actual patient care. And imagine what happens when more doctors learn to use FaceTime for remote consultations.)
  • Retail: 3%–4%. Global retail is ripe for creative destruction (consolidation, exit, or catch-up) given massive productivity gaps between retailers within countries and between retail sectors across countries (e.g., Japanese retail productivity is only about 40% of the U.S. level). The catalysts for change? In the McKinsey scenario, advanced analytics and big data will drive improvements in lean-store operations and supply-chain management. Competitive pressures are mounting, notably from the continued rise of e-commerce (80% more efficient than modern brick-and-mortar yet still only a small fraction of total retail activity – about 10% in the U.S.). “Modern” (i.e., large, as in not your local mom-and-pop) brick-and-mortar formats themselves are three times as productive as small, traditional stores – yet modern brick-and-mortar businesses are rare in much of the emerging world (where they represent a 25% – and often lower – share of total retail employment).
We could go on. Could government services, notoriously far behind the productivity frontier, be next in line for an upgrade? (For color, see Glaeser et al. 2016.) Evidence is trickling in that municipalities are turning to big data to better track their performance and provide public services more efficiently. And then there’s the education system ...
From micro gains to macro growth?
Could industry-level productivity gains boost global productivity growth in aggregate?
In our view, this (right-tail!) possibility is rising. And the microeconomic experts at McKinsey would seem to agree. In their 2015 report they draw from a collection of industry studies to project productivity growth through 2025 at the sector level – and then extrapolate these sector trends to global labor productivity growth in aggregate. McKinsey forecasts 4% potential annual productivity growth through 2025 – a jolt higher from the 2%–2.5% post-financial-crisis global average. (The forecast considers the G-19 countries plus Nigeria.) Note: This 4% forecast is based only on the diffusion of existing best practices and known technologies – i.e., before giving any credit to unknowable future innovations. As the study suggests, “Waves of innovation may, in reality, push the frontier far further than we can ascertain based on the current evidence.”
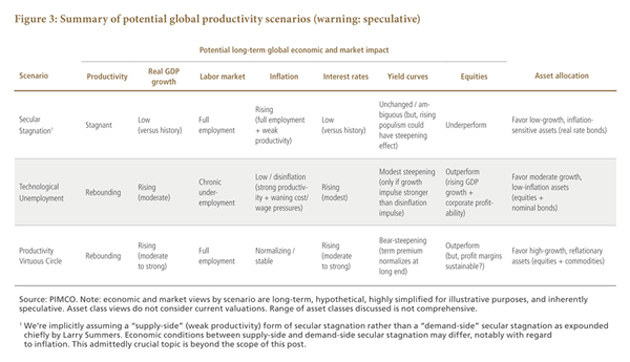
Three productivity scenarios and their investment implications
Broadly, we envision three possible scenarios for global productivity. The first is that our weak-productivity status quo – call it secular stagnation – persists. We all have a sense of what this paradigm means for economies and markets because we have been living through a version of it for years. The future effect of secular stagnation on interest rates is ambiguous – though we note that a continued global trend toward populism, absent a productivity rebound, could put a higher inflation term premium in nominal yield curves (causing curves to steepen).
The other two (more optimistic) scenarios both involve a productivity rebound; the resulting economic gains, however, manifest differently between them – and that’s because productivity growth can occur in two ways. Either innovation reduces required inputs for a given output (through efficiencies and cost savings), or innovation boosts output for a given input.
Productivity rebound scenario 1: ‘Technological Unemployment’
Under “Technological Unemployment,” innovation drives robust productivity growth through firm-level operational improvements and cost savings while chipping away at the demand for human labor. Productivity gains therefore come mostly from a reduction in (human) hours worked – mechanically, this is the denominator in the productivity calculation (output divided by total hours).
Consider the potential long-term economic and market impact of “Technological Unemployment” (note, we’re speculating and simplifying a lot here):
  • Global GDP growth picks up moderately
  • Inflation remains low and stable (a positive reflationary impulse from rising GDP growth is offset by a disinflationary impulse from falling costs and lack of wage pressure)
  • Labor market distortions and inequality worsen; chronic underemployment develops (too many workers, not enough jobs)
  • Global interest rates rise modestly from rock-bottom levels amid stronger economic growth (but disinflationary conditions limit the extent of the increase)
  • Yield curves modestly steepen, but only if growth impulse more than offsets disinflation impulse; otherwise, curves could flatten
  • Equity markets perform well given improving economic growth, muted inflation, and rising corporate profitability (falling costs and minimal wage pressure)
“Technological Unemployment,” in the extreme, is the scenario in which we humans are relegated to the beach while machines do all the work for us. The distribution of wealth across society could well become even more uneven given rising polarization between the “capital owners” and everyone else. This is a grim scenario for Main Street, and it would pose significant challenges – not only economic but also political and social.
Productivity rebound scenario 2: ‘Productivity Virtuous Circle’
Our “Productivity Virtuous Circle” scenario involves a different (and better!) type of productivity growth – one where innovation drives productivity gains without rendering human workers redundant. Here’s how. First, new technologies and processes employed in one industry generate cost savings and efficiencies in that industry. But they also create new jobs – jobs that require new skills we didn’t yet know we needed. A virtuous circle then develops: Technological growth in one industry forces related industries to innovate (or fall behind), creating even more demand for new skills. And on we go. The upshot: In this scenario there is no mass of discouraged (former) workers plodding off to the beach. Mechanically, productivity gains are driven mostly by a rising numerator (output) rather than by a falling denominator (hours worked).
Here is the potential long-term economic and market impact of “Productivity Virtuous Circle” (… still speculating):
  • Global GDP growth approaches “old normal” levels (4%+) in an enduring escape from secular stagnation
  • Inflation normalizes but remains well-contained (“demand-pull” inflation is offset by disinflationary impulse from positive productivity shock)
  • Labor markets strengthen (full employment and solid wage growth)
  • Global interest rates rise given strong economic growth
  • Yield curves bear-steepen (term premium normalizes at the long end)
  • Equity markets perform well given solid economic growth – but remain sensitive to the sustainability of profit margins (potential for labor to garner a larger share of the economic pie)
Clearly, in this scenario, bonds underperform in the short run (higher rates and steeper curves). But ultimately, we believe the “Productivity Virtuous Circle” would be the very best long-term outcome for fixed income investors.
We summarize the forces at play across all our scenarios in Figure 3.
What could go wrong? Barriers to diffusion
For the global economy to realize its full productivity potential under any rebound scenario, we need a lot to go right. While global industry leaders have enjoyed strong productivity gains in recent years, the median firm has not (recall Figure 2). The key to boosting aggregate productivity, therefore, is to speed up the diffusion of best practices from industry leaders to laggards. To maximize diffusion, governments need to continue to support free trade, a key enabler of global competition; liberalize product markets to enable the forces of creative destruction to do their work; make labor markets more flexible so that human capital will flow to its most productive uses; and help workers learn the skills required to best leverage tomorrow’s technologies. (Worthy topics for a future note …)
Bottom line: productivity’s upside risks are growing
So, what should we expect going forward? Secular stagnation or a productivity rebound? Our crystal ball isn’t that good. But whereas many market participants are coalescing around a secular stagnation baseline view, we are decidedly less convinced. In fact, we see a growing risk that we collectively underestimate the global economy’s pent-up productivity potential. It wouldn’t take a leap of faith to envision some variant of our “Technological Unemployment” productivity rebound (putting aside, in this note, its potentially serious social consequences). If future innovation displaces low-skill labor first, as we suspect it will, the impact on employment could indeed be negative – absent herculean worker-retraining efforts.
But don't count out a “Productivity Virtuous Circle,” which – lest we forget – is not lacking in historical precedent. The Luddites of 19th century England and their ilk have been wrong for two centuries; historically, over long periods of time, technological change has been a net creator of higher-skill jobs – and has not jeopardized full employment. (Over the past 50 years in particular, global labor productivity and employment have grown together in most multi-year periods.) Yet many observers seem certain this time will be different.
All told, we’d put better-than-coin-flip odds on a productivity rebound in some form in the coming years – and an escape from secular stagnation toward “old normal” global GDP growth. (The composition of GDP growth, however, will be skewed much more toward productivity gains than labor force growth.) The microeconomic catalysts have arrived. These catalysts – to recap, rising synergies in the use of leading technologies, declining costs, greater small-firm adoption and green shoots in services – may put 4% annual global productivity growth within reach. And that 4% includes zero credit for potential unknowable future innovations. (Yes, “unknowable unknowns” can be positive!)
There may also be a nascent macro catalyst at play. Global central banks are beginning to rein in extraordinary post-financial-crisis monetary stimulus, which – as our colleague Scott Mather suggests – probably has for years distorted the allocation of capital worldwide. The withdrawal of ultra-accommodative monetary policy may encourage a more efficient capital allocation throughout the global economy, potentially helping jumpstart creative destruction – the key to shrinking today’s massive productivity gaps.
Why, as investors, do we care? A productivity rebound could mean higher interest rates and steeper yield curves – greener pastures, indeed, for savers, pension funds and financial institutions. It could mean equity investors wouldn’t be doomed to a stagnant future of low returns. And it could boost the resilience of the global economy in the face of several looming secular risks. Productivity’s right tail is getting fatter; if history is any guide, the night often appears darkest just before dawn.
Closing Remarks from John
All of us might wish for a virtuous productivity cycle like the one they describe a scenario number two, and that is what has happened in the past. People left the farms and went to the cities to work in the factories and then moved on to other jobs. Technology created new jobs in the process of destroying past jobs. It was in the height of this process that Schumpeter wrote his famous “creative destructio” paper.
The problem with that scenario playing out in the future is that we literally had generations of time to adapt. If we had tried to go from 80% of the people working on farms in 1880 to 2% in 10 or 15 years – less than a generation – it would have been far more disruptive than the actual 20 generations it took. People had time to change.
I am far more concerned about today’s “technological unemployment.” Automated cars are just the tip of the iceberg. The Council of Economic Advisers thinks that 60% of lower-paying jobs will be automated in the next few decades. Where will these people go to work? Yes, we can retrain them for other work, but are they willing and able to be retrained? Will they be willing and able to move?
Given the nature of the change that I see coming, I think that income inequality will actually grow. In my upcoming book I will put a mathematical formula to it and demonstrate that in the future income inequality will be worse, no matter how you cut it. And increased taxes are going to slow down growth and reduce employment opportunities. There are no free lunches.
Add that in the coming debt crisis, the inevitable demographic changes and geopolitical tensions are going to contribute to the slowing of GDP growth. All of which makes it difficult to be a pure technological optimist. I mean, yes, we’re moving toward a world of abundance and marvelous new technologies, but like the past, the future will be unevenly distributed for quite some time.
And that does not even get into the issue that the way we measure GDP is so fundamentally flawed as to produce statistics that are essentially misleading. Seriously, to an economist, a $100 barrel of oil or two $50 barrels of oil have the exact same GDP impact. Ask a kindergarten child which is better, one cookie or two cookies? Just saying…
I will close here, but you get the thrust of what I’m trying to cover in the new book. I think that Matt and Joachim did a fabulous job in taking us on a thought trip and making us question our assumptions.