Quote of the day

“I find economics increasingly satisfactory, and I think I am rather good at it.”– John Maynard Keynes

Monday 30 November 2015

Apprenticeships and the new levy

Bit of supply-side material for you. Below is a solid analysis, from an educator's perspective, of the pros and cons of the planned growth in apprenticeships, funded by a levy on a very small number of large companies. This is a critical area for growth strategies, overcoming unemployment, and all things Human Capital. Excellent "however" [i.e. evaluation] material:


Is the employer levy a big deal? Definitely maybe

20th November 2015 at 00:00
The apprenticeship landscape is changing, but the ramifications aren’t yet clear
In less than 18 months a new apprenticeship levy will be imposed on large employers, changing the landscape of further education and apprenticeships beyond recognition. Definitely? Maybe.

When thinking about how big a deal the levy might be, it’s worth asking: why now? Levies aren’t a new idea. We had them in most sectors for the two decades up to the early 1980s. A couple still exist, in the construction and engineering sectors. In the 2003 skills strategy White Paper, the Labour government promised to support the development of new sector-based levies on a voluntary basis. Lord Leitch offered equivocal support for the same in his 2006 review, and the government followed suit in its 2007 White Paper (I know, I wrote it). The brilliantly Yes Minister talk of the time was of “post voluntarism” if employers didn’t get their act together and invest in skills.

So, have ministers finally tired of employers’ failure to recognise the way that skills drive productivity, which drives profitability and growth? Maybe. Or is the government just skint and in desperate need of new ways to fund tertiary education? Definitely. Are levies a proven policy measure, guaranteed to change behaviour? At best, maybe.
The evidence is pretty patchy. There hasn’t been a serious evaluation of the old industry training board regime. Evidence from overseas (France, Quebec, Malaysia and Australia have all operated levy regimes at some point) suggests a series of flaws, issues and risks.

What could go wrong?

Clunky and expensive administration can take resource away from training and undermine employer engagement. The Skills Funding Agency (SFA) is currently developing a digital voucher exchange to support the new apprenticeship levy, with employers that want to spend more able to buy additional vouchers at a discounted rate. What could go wrong? I’m fractionally too young to remember the individual learning accounts fiasco. Let’s hope that the survivors still in the Department for Business, Innovation and Skills and the SFA shout loud and often about the fractures, failures and frauds that killed an otherwise perfectly sensible attempt to put purchasing power in the hands of the customer.

Even where employers do engage in training rather than bearing the levy as a tax, there is little evidence of productivity improvements flowing from levy regimes. The risk is that we will see further growth in content-light apprenticeships that help the government to hit its target of creating 3 million starts but miss the point: better skilled young people, better able to realise their potential, improving business productivity and performance.

The other big flaw in previous levy regimes is that small firms tend to lose out because the levy unfairly hits their finances, and because they find it hardest to engage with whatever arrangements are put in place for them to access levy-funded training. On this point, the government has definitely got it right. Only “large” employers will be required to pay the levy, and they may be permitted to spend it in their supply chain – a great idea salvaged from the wreckage of the “employer ownership of skills” pilots.


What’s going to happen?

So what’s going to happen in 2017? For large employers faced with the prospect of a new tax, there are some big questions and opportunities on the horizon. We should assume that finance directors across the nation will soon be asking their HR colleagues a simple question: “How do we get our money back?” From that starting point stems either a serious discussion about how the business will invest in emerging talent, or one about what can be badged to ensure funding is reclaimed.

Some will ultimately choose to do nothing and bear the levy as another annoying tax. Some will do enough to spend their levy one way or the other. Others will be receptive to the intended behavioural nudge and get serious about training. Other policy measures – including a serious assault on bureaucracy, clearer and simpler marketing than we’ve ever seen, and (my favourite) human capital reporting requirements for large employers – will be required to cement the last option as the course taken by the majority.

Employers will also have unprecedented (if still limited) choice over who they work with to deliver their apprenticeship programme. Unprecedented because funding will, finally, follow the employer. Limited because only registered providers will be able to play. Again, different employers will make different decisions. Some will rethink their choice of provider now they’re really free to do so. Others will demand that their commercial learning and development suppliers enter the apprenticeship space. This could have profound implications for providers.

And what of providers? Grant funding ripped out of our grant letters; the dynamics of the sales process inverted; the opportunity to increase apprenticeship volumes without having to worry about whether government will fund in-year growth; employers compelled to engage with apprenticeships whether they like it or not; and the threat of new and commercial providers encroaching into our traditional backyard.

Threat? Definitely. Opportunity? Maybe. We set up Hart Learning and Development as a discrete business, at arms-length from North Hertfordshire College, to help us stave off the threat and seize the opportunity of the levy era. For me, then, is the levy a big deal? Definitely. Will it change everything? Maybe.


Matt Hamnett is principal of North Hertfordshire College and chief executive of the Hart Learning Group

Sunday 29 November 2015

Some thoughts about the global "soft patch"


     A Hard Look at a Soft Global Economy


MILAN – The global economy is settling into a slow-growth rut, steered there by policymakers’ inability or unwillingness to address major impediments at a global level. Indeed, even the current anemic pace of growth is probably unsustainable. The question is whether an honest assessment of the impediments to economic performance worldwide will spur policymakers into action.

Since 2008, real (inflation-adjusted) cumulative growth in the developed economies has amounted to a mere 5-6%. While China’s GDP has risen by about 70%, making it the largest contributor to global growth, this was aided substantially by debt-fueled investment. And, indeed, as that stimulus wanes, the impact of inadequate advanced-country demand on Chinese growth is becoming increasingly apparent.

Support Project Syndicate’s mission

Project Syndicate needs your help to provide readers everywhere equal access to the ideas and debates shaping their lives.
LEARN MORE
Growth is being undermined from all sides. Leverage is increasing, with some $57 trillion having piled up worldwide since the global financial crisis began. And that leverage – much of it the result of monetary expansion in most of the world’s advanced economies – is not even serving the goal of boosting long-term aggregate demand. After all, accommodative monetary policies can, at best, merely buy time for more durable sources of demand to emerge.

Moreover, a protracted period of low interest rates has pushed up asset prices, causing them to diverge from underlying economic performance. But while interest rates are likely to remain low, their impact on asset prices probably will not persist. As a result, returns on assets are likely to decline compared to the recent past; with prices already widely believed to be in bubble territory, a downward correction seems likely. Whatever positive impact wealth effects have had on consumption and deleveraging cannot be expected to continue.

The world also faces a serious investment problem, which the low cost of capital has done virtually nothing to overcome. Public-sector investment is now below the level needed to sustain robust growth, owing to its insufficient contribution to aggregate demand and productivity gains.

The most likely explanation for this public investment shortfall is fiscal constraints. And, indeed, debt and unfunded non-debt liabilities increasingly weigh down public-sector balance sheets and pension funds, eroding the foundations of resilient, sustainable growth.
But if the best way to reduce sovereign over-indebtedness is to achieve higher nominal GDP growth (the combination of real growth and inflation), cutting investment – a key ingredient in a pro-growth-strategy – is not a sound approach. Instead, budget rules should segregate public investment, thereby facilitating a differential response in fiscal consolidation.

Increased public-sector investment could help to spur private-sector investment, which is also severely depressed. In the United States, investment barely exceeds pre-crisis levels, even though GDP has risen by 10%. And the US is not alone.

Clearly, deficient aggregate demand has played a role by reducing the incentive to expand capacity. In some economies, structural rigidities adversely affect investment incentives and returns. Similarly, regulatory opacity – and, more broadly, uncertainty about the direction of economic policy – has discouraged investment. And certain types of shareholder activism have bred short-termism on the part of firms.

There is also an intermediation problem. Large pools of savings in sovereign wealth funds, pension funds, and insurance companies could be used, for example, to meet emerging economies’ huge financing needs for infrastructure and urbanization. But the channels for such investment – which could go a long way toward boosting global growth – are clogged.
Meanwhile, technological and market forces have contributed to job polarization, with the middle-income bracket gradually deteriorating. Automation, for example, seems to have spurred an unexpectedly rapid decline in routine white- and blue-collar jobs. This has resulted in stagnating median incomes and rising income inequality, both of which constrain the private-consumption component of aggregate demand.

Even the one factor that has effectively increased disposable incomes and augmented demand – sharply declining commodity prices, particularly for fossil fuels – is ultimately problematic. Indeed, for commodity-exporting countries, the fall in prices is generating fiscal and economic headwinds of varying intensity.

Inflation – or the lack of it – presents further challenges. Price growth is well below targets and declining in many countries. If this turns to full-blown deflation, accompanied by uncontrolled rising real interest rates, the risk to growth would be serious. Even very low inflation hampers countries’ ability to address over-indebtedness. And there is little sign of inflationary pressure, even in the US, which is near “full” employment. Given such large demand shortfalls and output gaps, it should surprise no one that even exceptionally generous monetary conditions have proved insufficient to bolster inflation.

With few options for fighting deflation, countries have resorted to competitive devaluations. But this is not an effective strategy for capturing a larger share of tradable global demand if everyone is doing it. And targeting exchange-rate competitiveness doesn’t address the aggregate demand problem.

If the global economy remains on its current trajectory, a period of intense volatility could destabilize a number of emerging economies, while undermining development efforts worldwide. That’s why policymakers must act now.

For starters, governments must recognize that central banks, however well they have served their economies, cannot go it alone. Complementary reforms are needed to maintain and improve the transmission channels of monetary policy and avoid adverse side effects. In several countries – such as France, Italy, and Spain – reforms designed to increase structural flexibility are also crucial.

Furthermore, impediments to higher and more efficient public- and private-sector investment must be removed. And governments must implement measures to redistribute income, improve the provision of basic services, and equip the labor force to take advantage of ongoing shifts in the economic structure.

Generating the political will to get even some of this done will be no easy feat. But an honest look at the sorry state – and unpromising trajectory – of the global economy will, one hopes, help policymakers do what’s needed.

Read more at https://www.project-syndicate.org/commentary/examine-reasons-for-slow-global-growth-by-michael-spence-2015-11#pEJeWssUuW7Jl0Pt.99

Friday 27 November 2015

A breakthrough moment in monetary policy?

Not one to exaggerate (?), I put this snippet before you now, to provide forensic evidence of the topic I talked about today - negative interest rates. Apparently a small Swiss bank, Alternative Bank Schweis (on the German side, I'm guessing) will be charging depositors 0.125% to hold money in a current account; anyone with CHF100,00 will be charged 0.75%. Apparently the bank funds "ethical projects", so maybe it is relying on the "ethics" (and wealth) of its customers... On the one hand, this is a non-story, who cares (apart from depositors?); however, in a few months it could become mainstream - i.e. negative interest rates could start to be the norm.

Why do I think this is worth mentioning? Well, after 6 years of 0.5% interest rates, and listening to Willem Buiter at the Royal Academy last year telling us that central banks are the "last man standing", then watching the Chancellor get creamed when he suggested cutting a mere £12 billion from a £130 billion welfare budget... I have the distinct feeling that not many options are left.

On the basis that you have exams to take, and grades to achieve, I don't recommend you explore this in detail, but anyone who faces an interview at university for a place, or just wants to be one step ahead, this is a very interesting development. It is not isolated, it is part of a creeping advance of weird monetary policy - "normal" because it just extends the idea of cutting rates, but also "weird" because the implications are really profound.

You'll have to catch me on a quiet day if you want me to explain this; otherwise just read some of the material that is decidedly non-mainstream to get a better understanding of what is coming in this supposedly "strong recovery" we are experiencing.

Trade union reform

I know, I know, trade union reform is a supply-side policy that is all about freeing enterprise from the stranglehold hold of bolshy unionistas; there is another side, however, nicely encapsulated in this from tutor2u:

Here is an excellent research document from the New Economics Foundation looking at the importance of trade unions in the modern economy and, perhaps, as a counterpoint to yesterday's Trade Union Bill.
I've just glanced at it but there's a lot of really useful data and whilst I'm unlikely to agree with all of the analysis, I still think that unions have an important role to play in the modern economy in enhancing productivity, employee education and protecting workers - not least in teaching.
This BBC clip looks at the Trade Union Bill and its implications for the Trade unions. I can see another lesson starter emerging for when we're studying trade unions.

Structural unemployment - short video


Sometimes structural unemployment can seem a little distant, and something we study as a technical issue. It is very real for some people, as this short clip from a 1989 documentary shows:


I am certainly not a fan of Michael Moore, but that does not stop me recognising that structural unemployment blights lives, as well as whole communities. It is an on going issue here in the UK, and despite successive governments throwing billions of pounds at the problem, is likely to remain so as our economic landscape evolves.

Monday 23 November 2015

Article highlighting inflationary effect of weak currency, & economic shocks

Russia faces another round of its economic crisis

The last few days have given us an old-fashioned indication of an economy in distress which is that regimes often look to cast a smokescreen over economic problems at home and potential unrest by indulging in military action and wars. An example of this has been kindly provided this morning by Russia Today.
Russian airstrikes have torched more than 1,000 tankers taking stolen crude oil to Islamic State refineries. This blow against the jihadists comes as the Russian Air Force has hit 472 terrorist targets in two days in Syria, making 141 sorties.
The Russian bear has a sore head and is flexing its muscles in response. Along the way it is sending hints elsewhere as for example by the way that its Backfire bombers have skirted UK airspace on their way to Syria and made the RAF’s day by giving them the opportunity to scramble in response. Indeed if the rumours prove true that today’s defence review will give the RAF 2 extra fighter squadrons then its messes tonight may echo to Vladimir Putin’s name. Of course in terms of economic consequences such a situation is only likely to cause further issues for the UK’s troubled public finances which continue to underperform.
Oil and commodity Prices
Another way of looking at the economic crisis for Russia is provided by the oil price. This morning the price of a barrel of Brent Crude Oil has fallen by 2% to below US $44. Now lets us add in how much oil Russia produces which Bloomberg has provided.
Output from January to October averaged about 10.7 million barrels a day, a 1.3 percent increase over the same period in 2014, the data show. That’s in line with the Russian Energy Ministry’s full-year forecast for production of 533 million tons, or 10.7 million barrels a day.
If we look back to 2011,12,13 and the first half of 2014 the oil price acted as if a tractor beam was keeping it at around US $108 per barrel as we have discussed on here in the past. So if we take these numbers forwards we see a loss to the Russian economy of the order of US $680 million per day. Now I doubt it gets the full oil price and some prices will be different to Brent Crude but this is clearly in broad terms a quantum shift for a commodity producer.
From the domestic point of view this will be insulated for a while by the fall in the Ruble which provides a short-term period of “money illusion” but as the consequent inflation washes through the system the effects will then spread. Also as Otkritie Capital point out the public finances take a large hit.
Through the tax framework, the government took the brunt of the blow, just as it used to take most of the windfall profits.
If we move to the other commodities that Russia mines and produces we see a similar story. This morning’s news on Bloomberg is like a list of things produced by Russia.
Copper fell through $4,500 a metric ton for the first time since 2009, while nickel dropped to the lowest level since July 2003. Zinc lost 2.5 percent as of 8:13 a.m. in London,
Russia is also the world’s main producer of palladium and last week we were told this.
Palladium, also mostly used in pollution-control devices, has plunged 32 percent, and prices are near a five-year low set in August.
Completing the series comes a reminder that Russia is a substantial gold producer as well and the drum beat continues. From Emirates 24/7 today.
Gold extended losses on Monday, falling towards a near-six-year low reached last week…….Spot gold had dropped 0.7 per cent to $1,070.36 an ounce.
The Ruble
This has fallen this morning so that it again requires some 66 Rubles to buy one US Dollar. If we look back to the better times for the Russian economy we see that it was in the low 30s so in essence the shift from the commodity boom to commodity disinflation and for Russia deflation has halved its currency. Quite chilling when put like that isn’t it?
We have seen quite a lot of volatility in 2015 as there was a rally to around 50 in May and a couple of times it has rumbled around 70. So we learn two things. Firstly how can Russian industry and businesses possibly plan in such a volatile environment? Secondly that rather than being a short sharp shock followed by a recovery this is something which to quote the Stranglers is “Hanging Around”. This leads to quite a different set of economic influences especially as we wonder if it will persist for long enough to be described as “temporary”?
Inflation Inflation Inflation
The September Monetary Report of the Bank of Russia summed it up like this.
Therefore, given the ruble depreciation in July-August 2015 and the elevated inflation expectations, consumer price growth in 2015 will be higher than expected – 12.0-13.0%.
This compares to a developed world average inflation rate that is in essence zero per cent and if we look to see the components we are told this.
the contribution of exchange rate dynamics to annual inflation in August was roughly 7 pp and lower demand reduced inflation by about 1 pp.
So the former tells us of  an inflationary burst and the latter tells us of a consequence of deflation. A combination which Britney has helpfully described for us.
Don’t you know that you’re toxic?
Two consequences
The first is that something which low inflation is helping in many countries which is real wages is seeing a doppelgänger in Russia. From Danske Bank today.
real wages growth (-10.9% y/y) shrank the most in 16 years
They also give us a clear consequence of this.
pushing retail sales to their lowest level since 1998 (-11.7% y/y)
Also I note that it is not a good time to be poor in Russia as a basic staple so basic in fact that central bankers describe it as “non-core” has done this.
High food inflation is weighing heavily on private consumers, posting 18.4% y/y in October and 21.2% y/y in the ten months so far.
The second consequence is much closer to home from my point of view as we note this from Bloomberg on the state of play in London’s property market.
Russian buyers acquired 4.2 percent of homes sold in central London’s best districts in the third quarter, compared with 10 percent a year earlier, according to broker Knight Frank LLP.
In Ruble terms UK property has doubled in price over the last 15/18 months as again it nudges 100 Rubles to the UK Pound £.  Russians who invested heavily in the UK in central London such as Roman Abramovich have played a bit of a blinder although it is probably best to hide such matters from Vladimir Putin.
Comment
Central banks especially ones subject to the whims of Vladimir Putin tend to have an optimistic bias so let us touch base with the Bank of Russia.
The Bank of Russia estimates GDP to contract by 3.9-4.4% in 2015…….According to the Bank of Russia forecast, GDP will fall by 0.5-1.0% in 2016 and the economic growth rates are expected to be 0.0-1.0% in 2017 and 2.0-3.0% in 2018.
As you can see things are not so good when even those with a clear incentive to get out the rose tinting can only forecast a return to growth in a period which fans of Carole King would describe as “So Far Away”.
If we move to other issues we see that Russia has quite a lot of the inflation that central bankers are trying to create on a smaller scale elsewhere and via the route (currency depreciation) which some are trying to get it albeit on a smaller scale. I think you would find that Russian consumers and workers would offer quite a critique of the effect on them.
If we move wider there is the ongoing issue of paying US Dollar denominated debt with ever more Rubles and that being deflationary in itself. Of course with interest-rates as shown below there is hardly much incentive to borrow in Rubles either.
the Bank of Russia decided to limit its key rate reduction to 50 basis points in July and cut it to 11.00% p.a.,
Added to these economic factors are the political and military which are intertwined with it. I discussed the military interventionism earlier and we also see Europe extending its sanctions but in economic terms the disruption is highlighted by this from the Wall Street Journal.
State of emergency declared in Crimea after pylons supplying energy from Ukraine are blown up.
Are we seeing inflation in states of emergency too?

Sunday 22 November 2015

Energy storage & renewables

Energy Storage Tech Finally Starting To Compete With The Grid

By 
Posted on Thu, 19 November 2015 21:58 | 0
Critics of renewable energy always cite the fact that the sun does not always shine and the wind does not always blow. As such, the intermittency of renewable energy needs to be backed up by baseload power, which would need to come from natural gas, coal, or nuclear power.
The key to resolving the intermittency problem is energy storage, but batteries have thus far been too expensive to offer a viable solution. But that is quickly changing.
Energy storage technologies are now cost-competitive with conventional grid electricity in certain markets. That is not the claim of some environmental outfit, but the conclusion of an in-depth study from asset management firm Lazard.
To be sure, there is still a ways to go before battery storage can compete on a mass scale. But Lazard finds that energy storage is actually a preferred option already in a few scenarios, such as replacing the need for major new transmission lines, or for circumstances where microgrids are needed. Lazard conducted its first levelized cost of energy storage. The analysis is complicated because storage can be valued in so many different ways. Energy storage not only can provide electricity during downtimes, but it can obviate the need to build new power plants. Or it can increase the reliability of the grid. These aspects make it difficult to come up with concrete cost figures, but Lazard lays out a range of cost scenarios. The bottom line is that energy storage is rapidly becoming cost-competitive.
Lazard also expects the cost of battery storage to decline significantly over the next five years, due to rising penetration of renewable energy and specific policies to support storage. At the same time, the aging power grid supports the economics of energy storage, as the costs of maintenance of transmission and the need for more power lines make energy storage competitive by comparison.
Moreover, major battery manufacturing facilities, such as Tesla’s gigafactory, are slated for completion, and the ramp up in battery production will bring down costs. Lithium-based batteries could see costs fall by 50 percent by the end of the decade, for example.
Taken together, Lazard arrives at a striking conclusion: energy storage could “be positioned to displace a significant portion of future gas-fired generation capacity, in particular as a replacement for peaking gas turbine facilities, enabling further integration of renewable generation.” These “peaker” plants tend to be much more expensive than regular power plants, and are only used when demand is at its highest. Over the next few years, it may no longer make sense to build peaker plants as batteries become the most cost-effective option.
There is often talk of a “utility death spiral,” in which rising electricity rates and falling renewable energy costs cause more ratepayers to abandon the grid. As fewer ratepayers are left to pay utilities, rates must go up to compensate, forcing more ratepayers to leave in an accelerated fashion.
Similarly, energy storage could see a virtuous spiral. More installations of batteries bring down costs. That allows more and more renewable energy to come online. The scaling up of both brings down costs even further, allowing for faster penetration. Meanwhile, the cost of transmission and of fossil fuel-based power generation are likely to go up.
In fact, according to Navigant, energy storage could grow from 196 megawatts today to over 12,700 megawatts by 2025.
Batteries will be helped along by public policy. For example, in Oregon, the major utilities will be required to install 5 megawatts of energy storage by 2020. Oregon is the second state, after California, to have a battery storage mandate. The law recognizes the multiple benefits that come with energy storage: Deferred investment on generation, transmission, and distribution infrastructure; reduced need for peakers; the ability to accelerate renewables deployment; improved grid reliability; and reduced price volatility.
All of those benefits are increasingly making battery storage a competitive force in electric power markets.
By James Stafford of Oilprice.com

Austerity takes an "interesting" turn:

Not confirmed, and because it is not exactly good news, it probably will come out in dribs and drabs:

Osborne to slash support for industry

Chancellor takes aim at grants for manufacturers and tax breaks for entrepreneurs in spending squeeze 

Kathryn Cooper, Economics Correspondent, and Kiki Loizou Published: 22 November 2015
The chancellor is struggling to meet his pledge to deliver a surplus by the end of this parliament The chancellor is struggling to meet his pledge to deliver a surplus by the end of this parliament
GEORGE OSBORNE is set to cut direct support for industry in a “challenging” autumn statement and spending review this week.
Funding for science and technology will be in the line of fire as the chancellor unveils the tightest fiscal squeeze of any advanced economy over the next four years, amounting to about 3.5% of GDP.
The move will be seen as a reversal of Osborne’s pledge in 2011 to unleash a “march of the makers”. Some of the country’s biggest manufacturers, including Rolls-Royce, have warned of dire consequences for the economy if direct grants are slashed.
Whitehall is believed to have agreed cuts of more than £20bn across unprotected ministries, including the business department, as the chancellor struggles to meet his pledge to deliver a surplus by the end of this parliament. The civil service is braced for a further 50,000 job losses.
Osborne could also hit entrepreneurs, one-man companies and motorists to make his sums add up. Business owners fear that entrepreneurs’ relief, which offers a lower rate of capital gains tax on profits of up to £10m, could be halved.
Industry insiders confirmed last week that part of the budget for science and technology — £4.6bn and £600m a year respectively — will be switched from grants to “a range” of funding options including loans. This will allow Osborne to claim that the overall funding pot has increased, even though direct government support has been cut.
The job of balancing the books has been made harder by worse-than-expected public finances this year. The House of Lords has blown a hole in the budget by voting down Osborne’s £4.4bn reduction in tax credits. 
Fuel duty could also be a target. Duty on diesel and petrol has been frozen since 2011 and the chancellor may decide that, with oil prices down by more than half over the past year, the country could shoulder a 1p or 2p rise in the duty.
About 400,000 contractors could lose out by about £400 a year from measures to clamp down on tax avoidance. The Treasury is expected to announce that those who work on short-term contracts, such as nurses, will no longer be able to claim tax relief on travel to a temporary place of work.

Evan Davies on why a banking-led recession is so bad

http://www.open.edu/openlearn/society/politics-policy-people/economics/different-recession

Monday 9 November 2015

US employment data was out on Friday. What is the outlook?


The Employment Numbers Say a Rate Hike Is Pretty Much Done
Let’s rewind the tape from an email sent out by Philippa Dunne of the Liscio Report  so we can see where the new jobs came from:
Employers added 271,000 jobs in October, all but 3,000 in the private sector. Construction added 31,000 (well above its average of 19,000 over the last year, though two-thirds of the gain came from nonres specialty trade, those who finish buildings); wholesale trade, an above-average 10,000; retail, 44,000, also well above average; finance, 5,000, less than half its recent average; professional and business services, 78,000, well above-average; education and health, 57,000, somewhat above average; and leisure and hospitality, 41,000, also somewhat above average. Government added 3,000, all from state government; local was unchanged, and federal, off 2,000.
Manufacturing was unchanged.
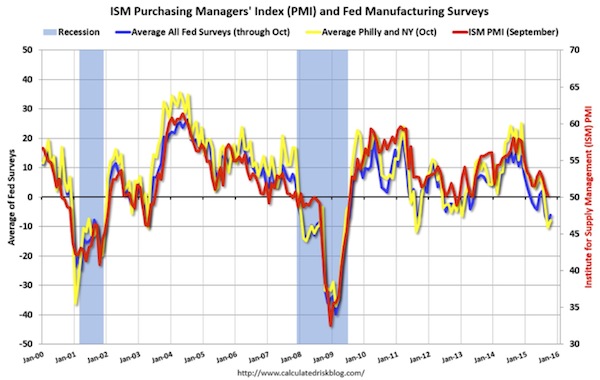
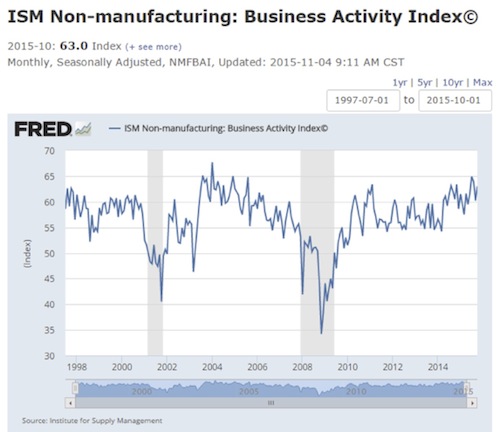
This employment report was all about gains in services industries, plus a little in construction. Which squares with the data we have seen in recent months from the regional Fed banks. Manufacturing is getting soft, and services are doing well. Let’s look at a few charts that will help tell the story. The first is an amalgamation of the regional Fed manufacturing indexes. The second is the national manufacturing index, and the last one is the national non-manufacturing (read services) index.
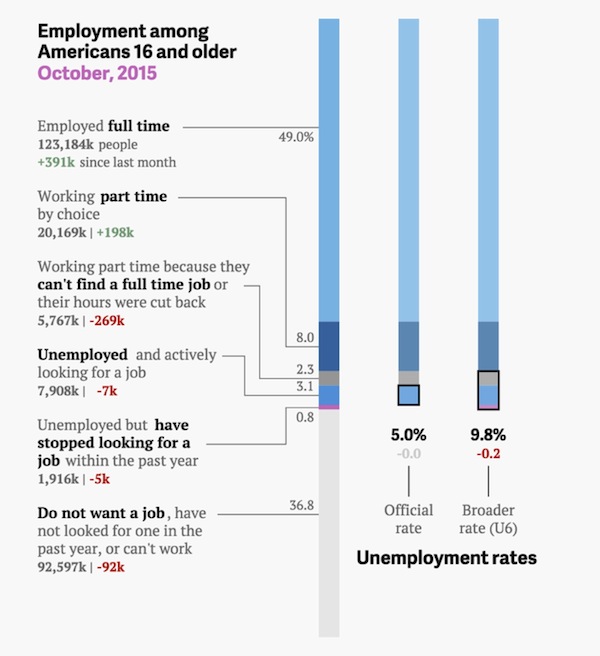
In researching this piece I also came across a very useful chart that breaks down unemployment by type. Let’s go straight to it and then add a few comments.
First, the above graphs look at both the official unemployment rate and the broader rate, which is called the U6 rate. The gap between the two measures is now the smallest in more than seven years, a sign that slack in the labor market is diminishing. And as the Fed weighs a potential rate hike, what may be more important is the number of people working part-time who would prefer to work full-time – that number posted its biggest two-month decline since 1994. Janet Yellen has referred to this number as often as she has to any other specific number. It is on her radar screen.
I’m in Miami, where I’ll be speaking at a conference where my friend David Rosenberg will also present. David has been predicting wage-push inflation from a tightening labor market for over two years now. He kept talking about the data, and I would look at it, but my old eyes couldn’t see the same trend or interpret it the way he did. And I admit I may have teased him about the lack of actual follow-through on that bit of data. Today’s data suggest that even though it’s a little early to declare a trend, there is clearly a hint of wage-push inflation in the air. David may even start taking victory laps. The labor market is getting a little tighter; and for reasons we’ll go into below, it may be even tighter than is apparent from the nonparticipation rate. So David may very well be right. Finally.
As my friend Joan McCullough writes:
Wage growth: +2.5%. Can you smell the wage-push? That’s the intention, so get used to it. So while extremely premature based on the metrics provided yesterday, not the least of which is wage growth in the 3.5 to 4% range as desirable to achieve 2% inflation, this is a start. And as you know, the FED only needs a “start.”
Behind the Unemployment Numbers
When we look at employment stats, we can easily forget that these percentages are not just numbers. Each category includes real people. Some are happy with their employment classification, but many aren’t.
The BLS data don’t capture every nuance. Frankly, that would be an impossible task. Laid-off factory worker Bob who sweeps floors at minimum wage 40 hours a week while struggling to avoid foreclosure is “employed full-time.” Attorney Bill with a six-figure income and two paid-for homes is also “employed full-time.” Bob and Bill are in wholly different circumstances, but we don’t see that in the data. We have no good numbers on how many of the 149.1 million employed people look like Bob vs. Bill. Income statistics help, but plenty of financially stressed people have above-average incomes. And the income data used in “research” is often distorted by political agendas. Income data is one example of the sort of statistics that you can torture to make the numbers say what you want them to say.
The BLS data does give us insight into some other employment categories, and that’s what I want to discuss today. We will see how many people find themselves in less-than-ideal circumstances and consider why they are there.
Who Is Unemployed and Why?
The Labor Department’s monthly figures come from surveys of both households and employers. Data from the household survey is what gives us the unemployment rate.
The October BLS summary table tells us the civilian noninstitutional population was 251.5 million. This is everyone age 16 and over who isn’t in the military, imprisoned, hospitalized, in a nursing home, or otherwise separated from society. That is out of a total population of some 319 million.
The “labor force” is a subset of the civilian noninstitutional population. If you are willing and able to work, you’re part of the labor force. The headline unemployment rate is the percentage of the labor force not working when surveyed last month. For October, 7.9 million unemployed in a labor force of 157 million gave us 5.0% unemployment.
Why are these people unemployed? BLS actually gives us considerable detail, but the media seldom dig that deep. Looking at the seasonally adjusted numbers in Table A-11, we see six categories.
• 933,000 were on temporary layoff from permanent jobs.
• 2.1 million were “permanent job losers,” meaning they previously had jobs but left them involuntarily.
• 899,000 had completed temporary jobs without finding new work.
• 789,000 were “job leavers” who voluntarily quit their last jobs.
• 2.4 million “reentrants” had left the labor force but were now looking for work again.
• 807,000 “new entrants” had never worked but were now looking.
[Note: I know the numbers don’t add up precisely. I think that’s because of a seasonal adjustment.]
Now, you can be unemployed without being “unemployed.” This is where it gets confusing. Retirees, full-time students, non-working parents, and others not working or seeking work are “not in the labor force.” They are neither employed nor unemployed.
This category has bedeviled economists since the last recession. The data is in Table A-16 of the BLS report. What are these 94.2 million people doing if they aren’t working? The number has been growing the last few years, but that might be because baby boomers are reaching retirement age.
More interesting is the subcategory of 5.7 million who say they want a job but are not actively looking for a job. How can those two things go together in the same person?
Last month BLS classified 1.9 million of the not-in-the-labor-force people as “marginally attached.” That means they want a job, have searched for work in the last year, and would take a job if they were offered one, but haven’t actively looked for work in the last four weeks.
Within the marginally attached category are 665,000 “discouraged workers.” They didn’t look for work (quoting BLS) “for reasons such as thinks no work available, could not find work, lacks schooling or training, employer thinks too young or old, and other types of discrimination.”
The other 1.3 million in the marginally attached group didn’t look for work, either, but “for such reasons as school or family responsibilities, ill health, and transportation problems, as well as a number for whom reason for nonparticipation was not determined.”
If we were to move the marginally attached people into the labor force as unemployed, the unemployment rate would look significantly worse. The size of the labor force would go up from 157 million to 159.2 million, and the number of unemployed would rise from 7.9 million to 10.1 million. That would make the headline unemployment rate 6.3% instead of the 5.0% BLS reported for October.
Conversely, if there were a way to address the issues that keep these people only marginally attached, the number of employed people would go up, and the unemployment rate would fall.
So what barriers leave so many people marginalized? I’ll list three that I think account for a significant part of the group. We have some hard data, but there will also be some speculation on my part. I’ll be curious to know whether your impressions match mine.
Unemployment in America Is a Felony
It has been a very long time since I submitted a resumé or filled out a job application (which is a good thing, because I think I’m essentially unemployable). My adult children and their friends tell me that almost every employer now wants to know if applicants have any criminal convictions in their background. Some even ask if the police ever arrested you, regardless of the outcome.
Thanks to the Internet, employers can and do run background checks on applicants, even if they don’t ask questions directly. Your odds of being hired drop sharply if they find anything.
How sharply? This is hard to pin down. Discriminating based only on a criminal record is illegal in many places, so hiring managers won’t admit to doing it. In any case, they can always find plausible reasons to put such applicants at the bottom of the pile. The effect is the same.
This is not a small problem. Pool data cited in a New York Times story last February revealed that 34% of all non-working men ages 25-54 had a criminal record. Is that the reason they aren’t working? We can’t say for sure, but I would bet it is a huge factor.
Thinking as an employer, I can understand why this happens. Legal liability is a big concern. If you own a repair service and your workers go into people’s homes, of course you don’t want to hire ex-thieves. If your workers drive business vehicles, you would be nuts to hire someone with DWIs or drug convictions. When you are looking at 10 applications for every job, it is easy to throw out the 34% that have felony charges. Boom. Gone. Look elsewhere.
At the same time, does it make sense to arbitrarily rule out an otherwise qualified applicant simply because of a youthful mistake? No, it doesn’t. The problem is that a prospective employer doesn’t know the individual’s story and doesn’t have time to find out.
I happen to know more than one young adult who’s stuck in that employment category. You probably do, too. They apply for jobs, get positive feedback… and then the employer suddenly loses interest without saying why.
It is extremely hard to stay motivated when this happens repeatedly. What can you do? The conviction will follow you forever. I would bet this explains a big part of the “marginally attached” group. They would work if anyone offered, but they have little incentive to search. They fall back on crime, welfare, or the kindness of family.
It is not just jobs. Most of the nicer apartment complexes in Dallas will not allow anyone with a criminal record to rent. My suspicion is that the situation is similar in the rest of the country. What happens is that we end up creating “ghettos” in certain areas where housing providers will rent to former felons and those who were merely charged with a felony in the past. Getting those records expunged is expensive and difficult.
And while I’m on the topic, the way we treat ex-felons in the justice system is criminal. I personally know of a gentleman who had a youthful drug issue, did his time, got out of prison, and, because he was a jack of all trades, was able to get work fixing things here and there. It was enough to put a roof over his head and feed his two teenage daughters, who were trying to finish high school. But the State of Oklahoma decided that he needed to pay $1000 in fines and reincarcerated him for six months. (Which probably cost them, say, $15,000?) There was no one to take care of his daughters, no one to pay the rent, and so on. This story is repeated all over America every day. The criminal justice system in the United States is more than broken, and it has gotten to the point where it’s more than blind; it’s simply dumb. Three percent of the country is either in jail, on probation, or on parole.
The only solution I can imagine would be a much stronger economy accompanied by labor shortages. Employers would then have incentives to accommodate less-than-ideal applicants, who frankly might have more incentive than most to work their derrieres off.
Parental Unemployment
“Family responsibilities” that prevent you from working are another way to land in the marginally attached group. This can describe many situations, of course. Childcare is a big one.
I know families who still match the traditional pattern: Dad has a job; Mom stays home with the kids. I know stay-at-home dads, too. They are the exception. Most families seem to need two incomes to support even a modest lifestyle. If both parents work, who takes care of the children all day? Especially if Grandma lives across the country?
Decent, professional childcare isn’t cheap. I know people who spend $1,000 per month per child. That’s for just a drop-off day care center. A full-time, reliable nanny costs much more.
As a strictly financial matter, paying that cost makes sense only if it allows one parent to recover the childcare costs plus earn quite a bit more. The job income will be taxable, too, while the imputed income from providing your own childcare is tax-free.
Suppose you have two preschool children. Mom has a $4,000/month job offer. To take it, she must spend as much as $2,000 on childcare. She’ll spend probably $1,500 more on taxes, commuting costs, and work clothes. Should she take the job? Probably not. Or she could cut back on the quality of the childcare she invests in and deal with guilt and worry about her children.
On the other hand, working when you break even or even lose a little can make sense if you continue to accrue retirement, keep your health insurance, and maintain an employment record that will lead to better-paying jobs in the future. When you stay home with the kids for a few years, it’s hard to regain that ground professionally. The economic impact of the choice to work or not to work is not limited to the years when the kids need childcare.
Deciding not to work puts the woman in the “marginally attached” category. She might work if a much-better-paying job came along, but she doesn’t actively look for one. I think this is a very common scenario that explains a substantial fraction of the “marginally attached” category.
Medical Unemployment
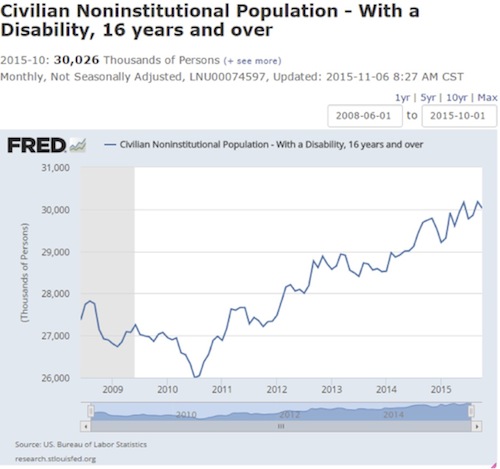
To be in the labor force, you must be physically able to work. You have no doubt seen stories about the sharp rise in disability claims since the last recession. Are that many people really disabled? Fourteen million get a disability check. About 57 million people – 19 percent of the population – had a disability in 2010 (the latest statistic I could find), according to a broad definition of disability, with more than half of them reporting that the disability was severe.
Here again, we don’t have good data. State governments and the Social Security Administration have a process for investigating disability claims, and I’m sure some people file false claims. The agencies probably do their best, but they can’t catch every fraudulent claim.
People who are legitimately disabled may or may not be in the labor force. They can earn small amounts without affecting their benefits. I think this is a good thing. The work gives them something to do and probably makes an otherwise hard life a little more bearable. A story came out this week that fits right in here.
Princeton economist Angus Deaton and his wife, Anne Case, also a Princeton economist, published a paper with surprising mortality data. Deaton, by the way, was recently in the news as the 2015 Nobel laureate in economics.
Their paper looks at death rates for middle-aged (ages 45–54) white Americans. They found a sharp increase in mortality rates between 1999 and 2013 for this particular group. The difference is stark and especially pronounced for those with lower education levels.
Even more surprising is what kills these people. It isn’t heart attacks or cancer. The most common causes of death were suicide, drug overdoses, and liver diseases linked to alcoholism.
Why are middle-aged white Americans dying at higher rates now? I can’t even begin to explain the racial aspect. Neither can Deaton and Case, apparently, but here is their economic speculation. I added some paragraph breaks.
Although the epidemic of pain, suicide, and drug overdoses preceded the financial crisis, ties to economic insecurity are possible. After the productivity slowdown in the early 1970s, and with widening income inequality, many of the baby-boom generation are the first to find, in midlife, that they will not be better off than were their parents.
Growth in real median earnings has been slow for this group, especially those with only a high school education. However, the productivity slowdown is common to many rich countries, some of which have seen even slower growth in median earnings than the United States, yet none have had the same mortality experience.
The United States has moved primarily to defined-contribution pension plans with associated stock market risk, whereas, in Europe, defined-benefit pensions are still the norm. Future financial insecurity may weigh more heavily on US workers, if they perceive stock market risk harder to manage than earnings risk, or if they have contributed inadequately to defined-contribution plans.
This makes sense, but I still don’t see why the same factors didn’t raise death rates for non-white Americans of the same age. But we certainly know that middle-class workers have massively underfunded their retirement programs.
How does this relate to employment? Among Deaton and Case’s cohort of 45 to 54 year  olds, there were probably many people who didn’t work. They were chronically sick, addicted, mentally ill, or otherwise incapacitated. According to the statistics, there were many fewer such people 15 years earlier, but the apparent large increase calls into question much of our historical data.
Deaton and Case drill into the problem:
Our findings may also help us understand recent large increases in Americans on disability. The growth in Social Security Disability Insurance in this age group is not quite the near-doubling shown in Table 2 for the Behavioral Risk Factor Surveillance System (BRFSS) measure of work limitation, but the scale is similar in levels and trends.
This has been interpreted as a response to the generosity of payments, but careful work based on Social Security records shows that most of the increase can be attributed to compositional effects, with the remainder falling in the category of (hard to ascertain) increases in musculoskeletal and mental health disabilities. Our morbidity results suggest that disability from these causes has indeed increased.
Increased morbidity may also explain some of the recent otherwise puzzling decrease in labor force participation in the United States, particularly among women.
By “morbidity” they mean sickness. The last line means they suspect people, especially women, are leaving the labor force for medical reasons.
You can read the study online for yourself. It is only six pages. The paper is more readable than most economic research. It really throws a wrench into some common assumptions. Some 500,000 American workers who should still be with us are now dead. What would the unemployment rate look like if they were still alive and healthy? We can only speculate. Moreover, it seems like that millions more in this group are very unhealthy. They are out of the labor force, as are family members who care for them. They are also consuming healthcare and other resources. That’s not positive for anyone. We would all be better off if these people were healthy and working.
There are a lot of other factors, some of them anecdotal, that may contribute to the large number of people who are not participants in the labor force. I hear a lot about age discrimination against older workers – people who are 50+ but not yet of retirement age. Job coaches actually tell people not to go back more than 10 years on their resumés or to include college graduation dates. I imagine it’s easy for older job seekers to give up the search and try to live on their savings or under-the-table work until they can get Social Security.
Another subcategory in the “marginally attached” group might be those with specialized skills that aren’t in demand where they live. The factory closed, but you can’t move because your house won’t sell. Learning to do something different in the latter part of your work life can be challenging.
Then there are people who are in a gap between jobs. You quit job A and have job B lined up, starting next month. You aren’t employed now, but you aren’t looking for work, either. Thousands of folks probably fall in that group at any given time.
And as I mentioned, there are many people who are recovering from illnesses or caring for relatives. “I’ll start looking for work as soon as the doctor lets me.”
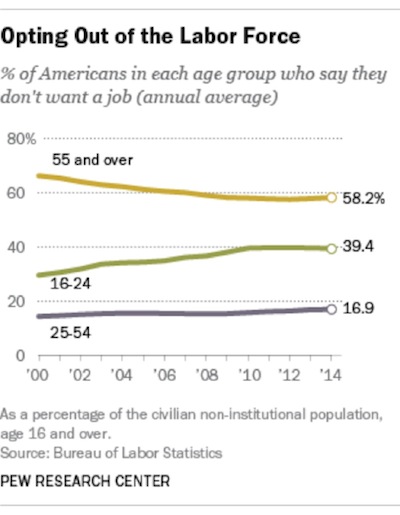
There is also the growing phenomenon of young people simply opting to stay home and not work. This from Pew Research:
[L]et’s look in particular at the youngest part of the eligible workforce. The share of 16- to 24-year-olds saying they didn’t want a job rose from an average 29.5% in 2000 to an average 39.4% over the first 10 months of this year. There was a much smaller increase among prime working-age adults (ages 25 to 54) over that period. And among people aged 55 and up, the share saying they didn’t want a job actually fell, to an average 58.2% this year.”
What we may be seeing at last is that many people who have been classified as “marginally attached” have already opted to go to work, along with many who were initially “not looking for jobs” and many who finally opted to take jobs at lower wages. So now, in order to entice additional workers, businesses may have to think about paying more money.
That is precisely what is supposed to happen in a tight labor market, and we have been waiting for one of those since the end of the Great Recession. Maybe the worker can finally catch a break. That would be good for everybody.