Quick intro, and it is a lot to read - try and identify one or two points that you can use in an essay; for most the sheet we discussed in class will be enough. This is highly technical, but should be accessible for some of you:
Don't let friends miss this compelling insight—share it with your network now.
John Mauldin | Apr 26, 2017
Hoisington Quarterly Review and Outlook, Q1 2017
Lacy Hunt and Van Hoisington kick off their Q1 “Review and Outlook” – today’s Outside the Box – with a bang, calling our attention to the fact that in 80% of the 14 Federal Reserve tightening cycles since 1945, a recession ensued, and the Fed managed to keep the Good Ship Economy off the rocks just three times.
And, oops, we’re in the 93rd month of the current expansion, farther out to sea than we were those three times when the Fed brought us safely in to port, in 1968, 1984, and 1995.
It gets scarier:
[T]he last ten cycles of tightening all triggered financial crises. In conjunction with the non-monetary determinants of economic activity (referred to as initial conditions), monetary restraint served to expose over-leveraged parties and, in turn, financial crises ensued.
Lacy and Van then proceed to enumerate four major ways in which those “initial conditions” are different (read: scarier) today than they were in any of the previous 14 tightening cycles.
Got your life jacket ready? Lacy will be helping us hand them out at this year’s Strategic Investment Conference, May 22–25 in Orlando. And you’ve heard me say it before, but I’ll say it again: The President could do far worse than appointing Lacy Hunt to fill one of the two empty Fed governor seats.
Be the best-informed person in the room with your very own risk-free trial of Over My Shoulder. Join John Mauldin's private readers’ circle, today.
Hoisington Quarterly Review and Outlook, Q1 2017
By Lacy Hunt and Van Hoisington
Fed Tightening Cycles – Past and Present
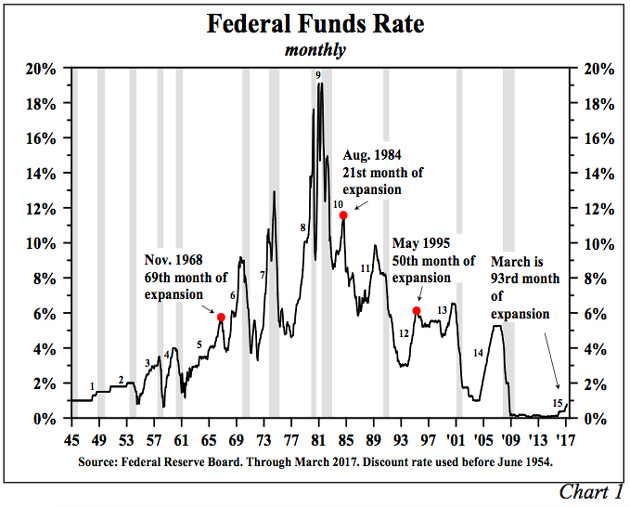
The Federal Reserve has initiated the fifteenth tightening cycle since 1945 (Chart 1). Conspicuously, in 80% of the prior fourteen episodes, recessions followed, with outright business contractions being avoided in just three cases. What is notable today is that the economy is in the 93rd month of this expansion, a length of time that is well beyond periods in prior expansions where soft landings occurred (1968, 1984 and 1995). This is relevant because the pent-up demand from the prior downturn has been exhausted; thus, the economy is extremely vulnerable to a shock, which could lead to recession. Regardless of whether there was an associated recession, the last ten cycles of tightening all triggered financial crises. In conjunction with the non-monetary determinants of economic activity (referred to as initial conditions), monetary restraint served to expose over-leveraged parties and, in turn, financial crises ensued.
Four important considerations exist today that were not present in past cycles and that may magnify the current restraining actions of the Federal Reserve:
The Fed has initiated a tightening cycle at a time when significant differences exist in the initial conditions compared to the initial conditions in prior cycles. Additionally, the Fed is tightening into a deteriorating economy with last year’s growth in nominal GDP worse than in any of the prior fourteen cases.
Business and government balance sheets are burdened with record amounts of debt. This means that small changes in interest rates may have an outsized impact on investment and spending decisions.
Previous Federal Reserve experiments, primarily the periods of quantitative easings, have led to an unprecedented balance sheet (an action of “grand design”) to which the economy has grown accustomed. The resulting reduction in that balance sheet (reduction in the monetary base) may have a more profound impact on growth than anticipated.
The monetary base reduction and the impact of the changing regulatory landscape, both in the U.S. and globally, has meant a significant increase in the amount of liquid reserves that banks are required to hold. Liquidity may have already been sharply restrained by the lowering of the monetary base, despite its massive $3.8 trillion size. This is evident as the monetary and credit aggregates are following the expected deteriorating pattern resulting from monetary restraint, suggesting recessionary conditions may lie ahead.
Poor Initial Conditions
To judge the success or failure of monetary or any other type of policy action, one must analyze in terms of the economic conditions under which the measures are being implemented. In other words, different starting points produce different results. Viewed from this perspective, the Fed’s current tightening is highly risk-prone for the economy.
Several factors that influence the economy (other than monetary policy) are far more problematic than those that existed in any of the prior tightening cycles. For instance, the U.S. is experiencing the weakest population growth since the 1930s and the lowest fertility rate since the records began. There has been a slowdown in the growth rate of household formation, and the U.S. has a rapidly aging society.
Economic growth. For the full calendar year 2016, nominal GDP rose just 3.0%, the weakest reported since 2009. Last year’s growth rate was even less than the cyclical lows associated with the recessions of 1990-91 and 2000-01. Rather unusually, at the March FOMC meeting, the Fed did not change its 2017 economic growth projections even though the broader first quarter indicators were even softer than last year, and their prior forecasts were made before they hiked the funds rate in December. Indeed, all of the key monetary variables that are heavily influenced by Fed policy operations deteriorated in the first quarter. Despite the lowest annual economic growth rate of this expansion and the second straight year of declining growth, no fiscal stimulus is expected for 2017. Monetary restraint implemented in late 2015 and 2016 has been followed by further restraint in 2017. How can the U.S. economy surge ahead this year with this additional restraint?
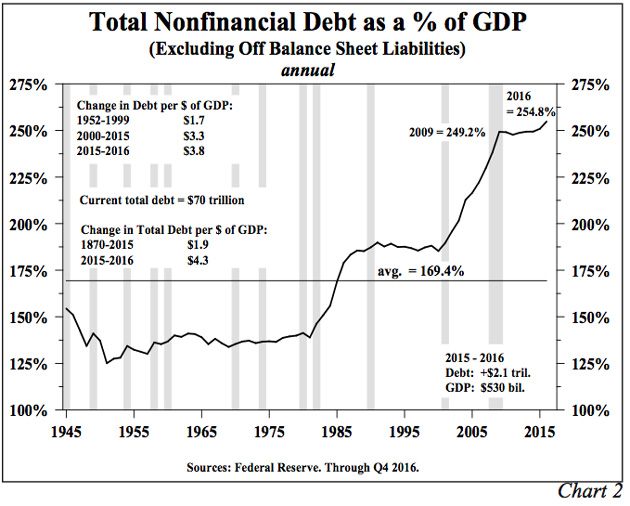
Debt. Total domestic nonfinancial debt, excluding off balance sheet liabilities such as leases and unfunded pension liabilities, surged to a record 254.8% of GDP in 2016, 5.6% greater than in 2009 when Lehman Brothers failed (Chart 2). Total debt, which includes domestic nonfinancial, foreign and bank debt, amounted to 372.5% of GDP in 2016, compared with 251.9% of GDP in 2006, the final year of previous tightening cycle, which, in turn, was greater than in any earlier time from 1870 through 2006.
The situation in the business sector deserves particular scrutiny. Business debt surged to a record 72.6% of GDP in 2016, for the first time eclipsing the prior peak of 70.2% reached in 2009. With the business sector so levered, not much room for miscalculation exists. As such, the risk is clearly present that the Fed’s restraint will chase out one or more heavily leveraged players, just as was the case in all the previous tightening cycles since the 1960s. Academic studies reflect that economic growth slows with over-indebtedness. Thus a powerful negative headwind is reinforcing the present monetary tightening.
The Fed Encounters Problems of Grand Design
Two macroeconomic textbooks (one written by Andrew B. Able (Wharton Professor) and Ben S. Bernanke (former Fed Chairman) and the other by N. Gregory Mankiw (Harvard Professor) both discuss over several chapters the transmission mechanism of monetary policy operations to the broader economy. Although they differ in some technical aspects, they both describe a very similar process as to how Fed restraint impacts economic conditions. Their independently taught process exactly describes what is unfolding in the reserve aggregates, short-term interest rates, bank loan volumes and the monetary aggregates today. However, the established process may more severely impact the economy because these actions are being taken in the aftermath of three unprecedented rounds of quantitative easing that have led to a massively enlarged Fed balance sheet (an action of “grand design”) coupled with the legislative adoption of the Dodd-Frank Law.
The late American sociologist, Robert K. Merton (1910-2003), who originated the concept of “unintended consequences”, identified the problems that arise when policy implements theories of grand design. Merton believed that middle range theories are superior to larger theories of grand design because larger theory outcomes are too distant for policy makers to realize how actions and reactions will change from the middle range theories under which they have typically operated. Merton argued that when dealing with broader, more abstract and untested theories, no effective way exists to test their success in advance.
We believe these are problems the Fed is already facing as their actions have changed the monetary landscape from previous periods of monetary restraint. The Fed (and the entire economy) is now caught in a new format that never existed, and thus is without the ability to anticipate the outcomes to policy because there is no historical reference point. We suspect that the results of the Fed’s tighter policies will be exacerbated by its own balance sheet and by the larger cash and liquidity requirements mandated by the Dodd-Frank Law. Not only must the textbooks be rewritten because of these legal and structural changes, but the Fed may also have to change the way it thinks about monetary policy’s transmission mechanism.
Contractions in the Monetary Base
To raise the policy rate, i.e., the federal funds rate, it is the theoretical norm for the Fed to act on the reserve aggregates, the most prominent of which is the monetary base and its subcomponents – total reserves and excess reserves. Able/Bernanke and Mankiw detail how changes in both influence economic conditions. The base, which is derived from a consolidated financial balance sheet of the Fed and Treasury, has an asset and liability side. On the latter, the base equals currency and total reserves. While the Fed does not have total command of the reserve aggregates in the short run, effective control is achieved over time.
The base is the key variable. If no fractional reserve-banking system existed, the liability side of the monetary base would be totally comprised of currency in circulation. In such an environment the central bank would have no power to change economic activity. On the other extreme, under a fractional reserve banking system where no one is allowed to hold any currency at all, the liability side of the monetary base would equal total reserves of the banking system. Changes in the Fed’s portfolio of assets would result in dollar for dollar changes in bank reserves. This still might not greatly change the central bank’s economic power. Whether depository institutions would put all of the total reserves to use in creating money and credit would still depend on a whole host of other considerations, including interest rates, the capital of the banks, the balance sheet of the potential nonbank borrowers and numerous other factors.
Historically, the higher funds rate was reached by a slower but still positive growth rate in the monetary base. This caused the upward- sloping credit supply curve to shift inward, thus hitting the downward sloping credit demand curve at a higher interest rate level. In graphic terms, the price of credit, which is the vertical component of a supply and demand diagram, is the policy rate, and the horizontal component is the volume demand for credit. The shift in the supply curve reduces the depository institutions capability to make loans while the higher interest rate also serves to reduce the demand for credit. The textbook writers do not add to the complexity of interest rate changes when, like now, the economy is heavily indebted. A small increase in interest rates leads to a large and quick increase in interest expense. But, current conditions differ from the textbook cases due to two powerful considerations.
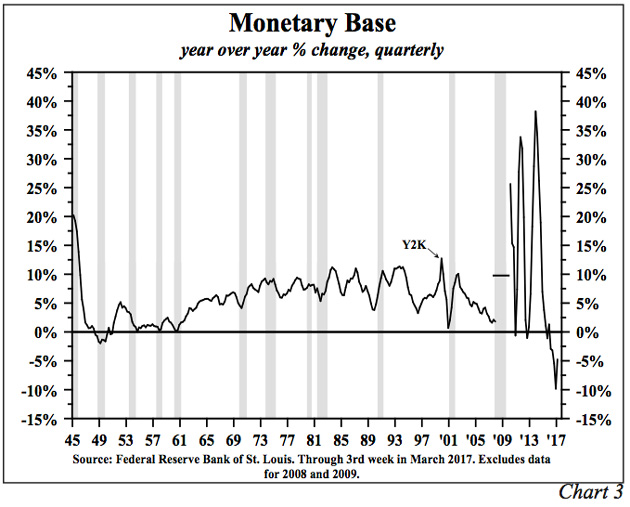
First, in the initial quarter of 2017, the year-over-year change in the monetary base was -4.8%. This comes after sharp contractions in each of the previous four quarters, the largest such decreases since the end of World War II (Chart 3). Some argue that this unprecedented weakness in the monetary base is not relevant since the depository institutions still hold $2.1 trillion of excess reserves (defined as the difference between total reserves and required reserves). The textbook writers emphasize that excess reserves are the key to money and credit expansion. But, the multiple expansion of bank reserves so diligently explained in the textbooks was written for a regulatory environment that no longer exists, which is the second different condition.
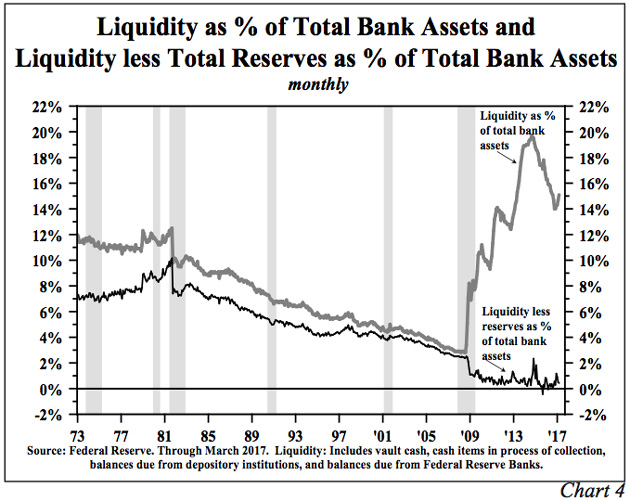
Beginning in 2015, large banks as well as banks with substantial foreign exposure are required to have a 100% or greater “liquidity coverage ratio” (LCR). This means the banks must hold an amount of highly liquid assets (such as reserve balances at the Federal Reserve Banks and Treasury securities) equal to or greater than the difference between their cash outflows and inflows over a 30-day stress period. Thus, excess reserves are irrelevant to the money creation process if the reserve balances are needed to achieve a 100% LCR. In line with the decline in excess reserves, there has been a dramatic reduction in bank liquidity, which has fallen nearly 17% (Chart 4). This reduction brings bank liquidity much closer to its LCR, altering bank management practices. Based upon an examination of all the monetary indicators closely linked to the policy rate and the reserve aggregates, the probability exists that the Fed, with three small increases in the fed eral funds rate, has now turned the money / credit creation process negative.
The Monetary and Credit Aggregates Respond
Since the Fed raised the federal funds rate in December 2015, the growth rates of the monetary and credit aggregates have slowed. In addition, banks have pursued tightening credit standards. As such, these developments are indicative of the changed ground rules.
In the past six months, the M2 money stock grew at a 5.9% annual rate, down from a 2016 increase of 6.8%, which is near the average increase in M2 since 1900. Thus, in a very short span, M2 has fallen from a trend rate of growth onto a slower path. The additional rate increase in March suggests that M2’s growth rate will moderate further over the remainder of the year. U.S. Treasury balances at the Federal Reserve Banks fell sharply in the first quarter due to extraordinary measures used to avoid hitting the debt ceiling. Dropping Treasury balances, all other things being equal, would boost M2. Thus a normalization of Treasury balances, assuming a debt ceiling resolution, will tend to slow M2 growth further.
Growth in the credit aggregates has slumped even more dramatically than M2, thus confirming and reinforcing the significance of the weakness in money. Growth in total commercial bank loans and leases slowed from an 8.0% rise in the first quarter of 2016 to 5.0% in the fourth quarter of last year. Although the figures for the first quarter are not yet complete and subject to revision, bank loans were essentially unchanged. Commercial and industrial loans, however, actually fell in the first quarter, a substantial turnaround from the 10.8% rate of increase in the first quarter of 2016. Residential real estate loans also fell in the first quarter, compared with a 4.0% rate of rise in the first quarter of 2016. Consumer loan growth remained positive in the first quarter, but the rate of increase was sharply cut.
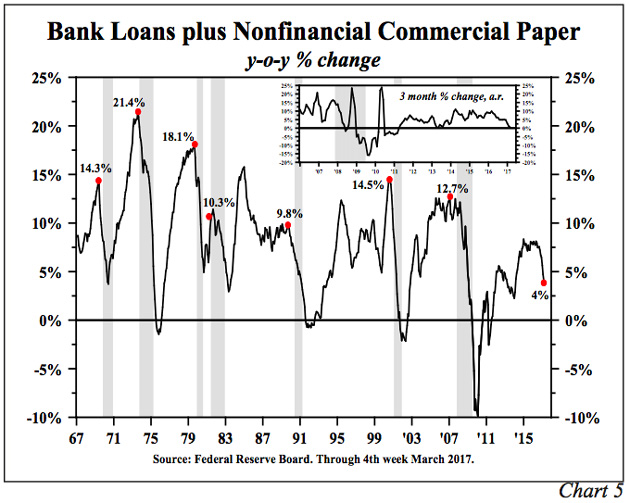
The most notable credit aggregate – total bank loans and leases plus nonfinancial commercial paper – has turned increasingly weak. In March this broad credit measure was just 4% higher than a year earlier and one half the peak growth rate registered in this current economic expansion that began in 2009 (Chart 5). As seen in Chart 5, the year-over-year changes in this aggregate indicate this is a very cyclically sensitive economic indicator. The year-over-year growth peaked prior to, or in the early stages of, all the recessions since 1969. Moreover, the latest growth rate is slower than at the entry point of the past seven recessions. In the last three months, no growth was registered in total loans and nonfinancial commercial paper. Historically, the three-month growth has not been this weak until the economy is already in recession.
Traditionally, money and credit slowdowns have resulted in tighter bank lending standards, and this is currently the case. In the first quarter survey of senior bank lending officers, almost 10% of the banks were tightening standards for both credit card and other consumer type loans. This was almost identical to the percentage when the economy entered the 2000 and 2008 recessions. Standards for commercial real estate loans have also been raised and in the first quarter were just below the levels when the economy entered the last two recessions.
In summary, monetary restraint is taking hold in all the different ways of measuring the Fed’s actions in a late stage expansion where historically the final result was either a recession, a financial crisis or both.
Repeated Results
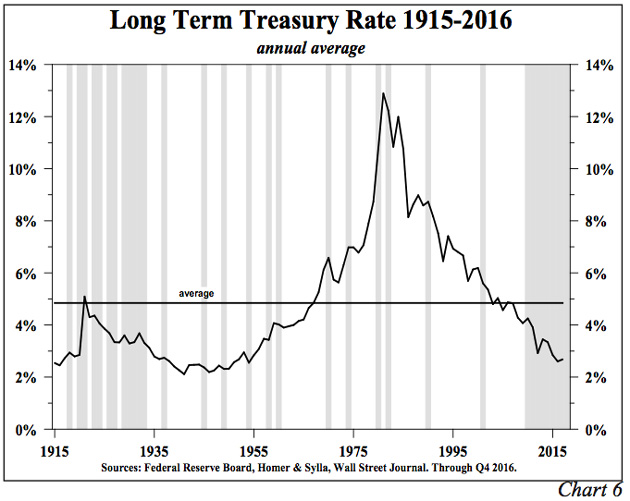
A century of Federal Reserve tightening cycles has left an indelible mark on the U.S. business cycle. Looking at the period from 1915 through the present, the Fed has typically tightened too much and/or for too long. From this long history, a well-established pattern is identifiable. The economic growth rate along with inflation receded. A financial crisis was more likely than not. With different lags, which were influenced by the initial conditions, bond yields dropped along with falling inflationary expectations (Chart 6). The cyclical trough in Treasury bond yields typically occurred several years after the end of the economic contraction. This long empirical record, as well as economic theory, indicates that the current Fed tightening cycle will not end any differently.
Looking Ahead
Our economic view for 2017 remains unchanged. We continue to anticipate no more than 2% growth in nominal GDP for the full calendar year. This is in line with the recent trends in M2 growth coupled with an anticipated decline in M2 velocity of 3.6% (M2*V=GDP). The risks, however, are to the downside. M2 was probably boosted by what will eventually be a transitory drop in Treasury balances at the Fed. Although not the main determinant, a rise in short-term rates would negatively influence velocity. The downturn in nominal GDP growth suggests that a rise in inflation to above 2% will be rejected and that by year end the inflation rate will be considerably slower. In such an economic environment long-term Treasury yields should continue to work irregularly lower over the balance of the year.
Our view on bond yields does not change if the Fed further boosts the federal funds rate this year. Any additional increases will place further downward pressure on the reserve, monetary and credit aggregates as well as tighten bank lending standards. Such actions will not allow the economy to regain the economic momentum that was lost in 2016 and in the early part of this year. Thus, the secular low in bond yields remains in the future, not the past.
This is American, but you can use this as a quick example for context, or even evaluation:
What we really need is moderate growth, and it would create enough opportunity for the currently unemployed.
Kim Zeuli, senior vice president, ICIC
Two of the biggest – and most often overlooked – drivers of economic growth are affordable housing, and the right training (job seekers need to be taught the right skills to fill the right jobs). These factors are what small businesses rely on, and, according to the ICIC, small businesses are the primary driver of job creation in metropolitan areas. In fact, a modest increase in the number of employees hired by existing small businesses — one to three employees per business — could create enough employment opportunities for all currently unemployed inner-city residents, the nonprofit explains.
So here’s a bright idea: Why don’t we do more. Why don’t we help small businesses grow by subsidizing the salaries they pay to new hires? As it happens, some corporations have a similar idea. Recognizing that small businesses are critical for economic growth, JPMorgan Chase has partnered with ICIC as part of its Small Business Forward initiative to help support women, minority and veteran-owned small businesses. JPMorgan Chase has also set aside $250 million over the next five years to provide training to individuals to get their skills up to speed, thereby closing the skills gap that adds to the unemployment numbers.
”[Jobseekers] all don’t need to be highly skilled,” Zeuli notes.
However, financial support alone isn’t enough to get all small businesses matched with the right employees and ready to flourish. Small business owners also need help with recruitment, because they usually don’t have their own human resource departments and are juggling so much, Zeuli explains. Emily Miethner, founder of FindSpark, a small, New York City-based business with five employees that helps companies of all sizes find talent, says smaller businesses often don’t have as much structured training as bigger firms. So for them it’s more important to find the ideal candidates who can “hit the ground running.” The best small business hires? Self-starters with a proactive work ethic and an entrepreneurial spirit, she says. When the match isn’t one that perfectly aligns, the results can be detrimental for small businesses.
Still, this concept could be a step in the right direction. Will it solve unemployment immediately? “No, it’s not a silver bullet,” Zeuli admits. “But it’s a provocative idea certainly worth exploring, because what we’re currently doing isn’t working.”
Here, in a nutshell, are a few ideas you might try to extend your answers with in a strong conclusion; luckily Moneyweek has summarised this information for you. The full article can be found here.
Escaping neoliberalism
WE CAN LOOSEN THE GRIP OF POPULISM
Stagnant economies and the rise of the populists have been the broad themes to emerge over the past few years, but few have delved into their causes, say James Montier and Philip Pilkington on GMO.com. Both have their roots in “neoliberalism”, the system of economic governance that arose in the mid-1970s and is characterised by globalisation, flexible labour markets, and a focus on maximising returns to shareholders at the expense of reinvestment and growth. Escaping from neoliberalism will involve restructuring our economies on more equitable and sustainable lines. Here’s what we need to do.
First, stop trying to steer the economy with monetary policy while shirking the responsibility for maintaining full employment. Instead, the government should offer a fixed wage for any labour that is forthcoming, which will be the de-facto minimum wage. When unemployment is high, workers will flow into the government scheme and be outsourced to private charity groups and put to work on any number of jobs that are currently not done – cleaning rivers, helping the disabled, caring for the elderly, planting public gardens, and so on. When times are better, employers can lure workers back by offering higher wages.
Second, to mitigate the negative effects of trade globalisation, run a policy of import substitution. Governments should identify the products currently cheaply imported from abroad that could easily be made here. Then offer direct subsidies to companies willing to produce these products. This should be thought of as part of a broader policy of reindustrialisation.
Third, frown on corporations that maximise shareholder value at the expense of investment and growth. This is really a corporate choice, not a government one, but corporations should be warned that they need to get their house in order before it’s too late – “populists have policies too, you know”.
Finally, unionise the workforce. Unions have been demonised for four decades, but they can play a fundamental role in ensuring that the distribution of income is fair and that the macroeconomy is balanced. “If policymakers fear striking workers and hot-headed shop stewards, they should look to the Scandinavian countries where capitalist worker-government relations are excellent because everyone treats one another with respect, everyone gets a seat at the table, and equitable outcomes are reached.”
Use parts of this to show you understand what the government needs to do to make sure apprenticeships achieve the desired outcome:
The minister says he believes that apprenticeships will be one of the greatest success stories of the decade
National Apprenticeship Week 2017 is unlike any other week. Not only are we celebrating the 10th year of the event, but we are also highlighting the best of the best and showcasing some of our most hardworking, aspirational apprentices and employers around the country – from Avon to Worcestershire.
Apprenticeships work. Some 90 per cent of all apprentices go on to work or further learning after they have completed an apprenticeship. This really is something to shout about.
It is fantastic to see that we have been making considerable progress towards Britain becoming an apprentice and skills nation.
Apprenticeship participation stands at nearly 900,000 – the highest figure on record.
With this in mind, the role of National Apprenticeship Week in raising the prestige of apprenticeships and transforming the nation’s skills base has never been more important.
Climbing the ladder of opportunity
I’m passionate about apprenticeships because they give millions of people the chance to climb the ladder of opportunity, the ability to earn while they learn, and a way to get the jobs, security and prosperity they need for their futures.
Since I started my role as apprenticeships and skills minister – something that I am extremely proud of – I have been working tirelessly to make sure that apprenticeships are viewed as a high-quality option, alongside further and higher education, which provides opportunities for people to progress.
On the prestige of apprenticeships, our “Get In, Go Far” campaign features remarkable ambassadors who demonstrate the power of apprenticeships. I had the pleasure of meeting one of these ambassadors, Chris Achiampong, at the National Apprenticeship Awards this year.
We need to carry on working just as hard to make sure we get the message out there.
Our reforms to apprenticeships are all about quality, quality, quality. We do not just want 3 million apprenticeships by 2020, we want 3 million quality apprenticeships.
Since May 2015, around 780,000 apprenticeship have been started – this means 780,000 lives changing and improving. I want us to continue extending our ladder and building on this momentum.
This is why, as part of our reforms, we are putting employers in the driving seat. They are best-placed to know exactly what skills they need and are central to designing new quality apprenticeships.
I truly believe that apprenticeships will be one of the greatest success stories of the decade
With our eight quality board members and an operational plan out for consultation, the Institute for Apprenticeships is well on its way to launching in April.
The key guarantor of apprenticeship standards, it will throw out any apprenticeships that are not good enough, ensuring that every apprenticeship is of high quality.
We are putting our money where our mouth is. Through the new apprenticeship levy, £2.5 billion will be invested in apprenticeships by 2019-20 – that is double the amount spent in 2010-11. With more money than ever, we will be helping people get into more and better quality training schemes.
I truly believe that apprenticeships will be one of the greatest success stories of the decade. I hope that National Apprenticeship Week 2017 inspires more employers and people to pursue an apprenticeship, helping us on our way to creating an apprenticeships and skills nation.
Robert Halfon is apprenticeships and skills minister. He tweets @halfon4harlowMP
You know how I talked about how bad the UK is at commercialising the research it does in its universities? All this is changing. Material like this adds real weight to your essays:
British universities are teaming up with venture capitalists to create world-beating firms. Back the winners before they leave the lab to make big gains, says Matthew Partridge.
When it comes to research, Britain has some of the best universities in the world. The latest World University Rankings from Times Higher Education put Oxford and Cambridge in first and fourth places respectively, while Imperial and UCL also make the top 20. Yet until recently British universities have struggled to exploit their discoveries. While many American institutions have taken commercially promising research and built world-beating companies out of it, British universities have tended to sell their best ideas to outside companies early on, missing out on the profits further down the line.
However, in the last 15 years or so, British universities have been playing catch up. According to Tomas Ulrichsen of Cambridge’s Centre for Science, Technology and Innovation Policy, the turnover of active companies spun out from UK universities has quadrupled since 2002/2003, from £466m to £1.84bn now. High-profile success stories include mobile video games company NaturalMotion, which was spun out of research done at Oxford’s zoology department. It was bought in 2014 by US gaming giant Zynga for $500m. And in December, gene-sequencing firm Oxford Nanopore made headlines when it raised £100m from investors.
So what’s driven this improvement in commercial nous? How do universities and venture capitalists turn ideas into world-beating companies? And – most importantly – how can you invest in these British success stories before they leave the lab?
How ideas get turned into cash
Most university commercialisation follows a two-stage process. If an academic comes up with an idea that they think could become a product or company, they can approach their institutions’ technology transfer office. The office will help them to find a way to exploit it, either by licensing the technology to another company (who will pay for the right to use it), or by setting up their own firm (a “spin-out” company – one based on university intellectual property). If they want to go down the spin-out route, the university will try to put them in touch with potential investors, and may also invest itself.
According to the academics and venture capitalists I spoke to for this piece, one of the biggest driving forces behind the increase in spin-out activity and other forms of commercialisation is the Research Excellence Framework, which was set up in 2008 and formally carried out three years ago. This requires universities to demonstrate economic impact in order to secure funding for research. In theory, this can be done in many ways – the impact can be social as well as commercial, for example. However, as Adam Stoten, head of technology transfer for life sciences at Oxford, points out, universities that have already set up successful companies are particularly well placed to attract funding because “spin-outs are extremely tangible evidence of impact”. This has encouraged universities to back commercialisation more aggressively. Many have headhunted key staff from the private sector and industry. As a result, and while there is still room for improvement, in “the last 15 years university technology transfer offices have become a lot more sophisticated”, says Hugh Campbell of investment bank GP Bullhound, which specialises in advising technology firms.
As well as offering logistical support and advice, universities are investing their own hard cash. Seed money and “proof of concept” funds allow researchers to figure out if a discovery has any commercial potential, and in some cases, to produce prototype products. Being able to demonstrate that an idea can be turned into a working product, or that there is a market for the technology, makes it far easier for researchers to approach investors for the funds they need to take a spin-out to the next level. Some universities also offer cheap facilities, such as office space or extended access to laboratories, to spin-outs and start-ups.
Academic resistance to enterprise has reduced greatly too. That’s partly a generational phenomenon. While established scientists once saw the idea of profiting from research as “grubby”, says Stoten, younger researchers “naturally embrace the idea” of setting up firms to exploit their discoveries. As these scientists “get promoted and move into more senior positions within academic departments” they are opening up their universities to the opportunities in commercialising research and ideas.
Indeed, science students increasingly “expect university support for entrepreneurship and start-ups in the same way that they want better sport facilities”, says Simon Bond of SETsquared, an investment partnership between several universities. “Yesterday’s students wanted to headline Glastonbury,” agrees Gregg Bayes-Brown of Oxford University Innovation. “Today’s students want to generate headlines in TechCrunch [a news website reporting on technology businesses].” In short, when it comes to commercialisation, the “winds of change are blowing through campuses”.
From idea to spin-out
So how does all of this work in practice? Tony Raven, CEO of Cambridge Enterprise, of Cambridge University, explains that it has three main funds: a seed fund, a later-stage seed fund and a follow-on fund. The seed fund is designed for firms that are just starting out, or are at the proof-of-concept stage. This comes from the university itself.
The second fund, called the University of Cambridge Enterprise Fund, is targeted at companies that are slightly further down the development path, and involves both university and alumni money. The final fund, Cambridge Innovation Capital, uses money from both the university and private investors to target companies that have advanced beyond the development stage, but need a lot more money to expand properly.
The University of Oxford has a similar structure. Oxford University Innovation (OUI) is the first port of call for academics, and offers support and legal help with patenting. If OUI and the academics think the idea is worth pursuing as a spin-out (or a start-up, for discoveries that aren’t immediately patentable), then they will be referred to Oxford Sciences Innovation (OSI), an investment company owned by both the university and private investors. OSI provides venture-capital funding that will hopefully get the company to the point where it can be floated on the stockmarket.
Beyond Oxford and Cambridge, while most universities have their own technology transfer offices, not all can afford to have their own dedicated investment funds. But institutions are teaming up to produce investment companies.
The aforementioned SETsquared Partnership is one such collaboration between the universities of Bath, Bristol, Exeter, Southampton and Surrey. SETsquared aims to provide enough funds to incubate companies set up by students, staff and alumni of the five universities. Touchstone Innovations, meanwhile, has grown from its origins as the private arm of Imperial College to fund spin-outs from other institutions.
A key part of this process is to ensure that both the university and academics get a fair share of any spin-out company’s equity, although their ownership will inevitably be diluted as other investors put capital into the company. Bayes-Brown notes that, “technically, employment law states that all intellectual property is the sole property of the university”. However, enforcing this strictly would give academics little incentive to develop their ideas, so Oxford splits initial ownership 50-50, which is on a par with the US, where the academic typically gets around 45% (Cambridge divides equity on a “case by case” basis).
Patient capital
Despite the great strides that have been made in recent years, there are still problems. The “valley of death” that used to lead to most spin-outs quickly failing for lack of funds “has largely been overcome”, argues Raven. However, “we still need to find the sources of capital that will allow firms to scale up into billion-pound companies, without having to leave the UK”. This is a bigger problem for some sectors than others. “While some IT companies can become profitable relatively quickly, with one machine learning company breaking even within two years”, life-sciences companies can still require venture-capital funding for well over a decade: “some drugs can take up to 17 years to be approved”.
“Finding the right investor can be a real problem,” agrees Stoten. But one solution is starting to emerge as a major asset class – so-called “patient capital”. This is essentially longer-term venture capital (VC). Stoten notes that traditional VCs expect to get a return on their investment within three to five years, either via a takeover by a larger company or a listing on the public markets. However, “patient capital” specialists are willing to wait for around a decade before they start to see a return on their investment. One prominent champion of “patient capital” is high-profile fund manager Neil Woodford, who acknowledges that it’s tough. “The journey from start-up to a successful scaled technology business is long and often bumpy,” he says. So investors “need to work closely with the early-stage businesses they have backed in pursuit of commercial success” and any partnership must have “the resilience to survive the frequent set-backs these companies have on the road to scaled success”. Interest in patient capital is growing – especially with the government reviewing the various tax incentives for this type of investment – but there is still “a distinct lack of appropriate capital”.
However, while this lack of long-term investment is bad for British science it is, paradoxically, good for investors, says Woodford. Because “demand for capital from early-stage companies is high, but the supply of it is very low”, it means “the returns on capital… are potentially very high”. Indeed, his decision to leave Invesco three years ago was partly motivated by his interest in investing in university spin-outs. In 2015 he set up the Woodford Patient Capital Trust, which aims to take stakes in unlisted university spin-outs. We look at the fund – plus other promising options – below.
Tap the stars of the future with these top spin-outs and funds
Oxford BioDynamics (LSE: OXF) was spun out of life sciences research at the University of Oxford. Its main product is a blood test that can be used by drug companies to determine whether certain drugs will work for an individual patient, or if they could have side effects. Revenues are just starting to grow, and it is yet to make a profit, so it is a risky investment. However, the rewards could be huge – consultancy McKinsey reckons the global market for diagnostic products for personalised medicine will reach $6bn by next year.
University of Nottingham spin-out Oncimmune Holdings (Aim: ONC) listed on the Aim exchange last year. Its main product is a blood test that can detect early-stage lung cancers before they spread, greatly boosting the chances of long-term survival.It has already sold 150,000 of these tests, mostly in the US, and expects global sales of this product alone to reach $590m in the next four years. It is currently evaluating similar tests that will enable rapid detection of ovarian and liver cancer, which it expects to launch later this year.
Kromek (Aim: KMK), which spun out of Durham University, develops radiation detection products. These devices have several uses – in the nuclear industry, medicine, and airport security. Recently Kromek won a contract to deploy its bottle scanner at an Asian airport, while a baggage scanner containing Kromek components received approval from the US Transportation Security Administration. The US Department of Defence has commissioned it to develop a radiation detector that can be used in harsh environments. Sales are rising, although Kromek has yet to make a profit.
If you’d rather invest in what is effectively a fund of spin-outs rather than individual stocks, consider Touchstone Innovations (LSE: IVO) – formerly Imperial Innovations. It invests in spin-outs from Imperial College London, but also in those from other universities in the “golden triangle” – including Oxford, Cambridge and University College London. At the end of 2016 it held 107 firms, in areas from engineering to biotech. It’s currently loss-making, but if even a handful of its investments succeed, you could enjoy a big payday.
Another option, as noted above, is Woodford Patient Capital Trust (LSE: WPCT), which was set up by Neil Woodford to make money for investors by providing much-needed long-term capital to university spin-outs. The trust owns many small listed and unlisted companies. It focuses primarily on the healthcare and biotech sectors, but also owns a big stake in Oxford Sciences Innovation, the main venture capital fund for Oxford spin-outs, giving investors access to some of the world’s most promising start-ups. It has a small ongoing charge of only 0.18%, plus a performance fee of 15% of any returns above a 10% benchmark.
Some very useful material for essays, particularly to avoid those "lame" conclusions; you will have to go through the whole thing, but you can skip the detail and just note down material you might use - here's a snippet:
We should judge economic systems by their results. When judging the much-maligned “neoliberal era” from the late 1970s to 2016, what matters is whether it made people’s lives better or not.
This era, I believe, has seen enormous progress in terms of wealth creation and improvements in the wellbeing of both Britain’s and the world’s poor. Opening markets up and exposing incumbent firms to competition led to a massive increase in wealth that ended up in the pockets of the many, not the few.
This system is now under threat from people who want to undo the reforms of this era from both the left and the right. Anybody who prefers prosperity and growth to stagnation must now make the preservation of the global liberal order their main priority.
The global picture
Everyone used to be poor. The default for mankind is poverty – the question isn’t why people are poor, but how anyone has become rich.
Before the industrial revolution, even the richest kings enjoyed a standard of living and a life expectancy below that of the average person in the West today. This began to change in the 19th and 20th Centuries, but improvements in people’s lives were concentrated in the Western world and Japan.
But, since the mid-1970s, that has begun to change. Global absolute poverty has been in free fall since the current era of globalisation began, and China and other developing countries began to adopt more trade- and market-friendly policies. Trade and market liberalisation seems to have been the major driving force behind this uplift in incomes and living standards.
The figure above shows global trade as a percentage of GDP since 1960 – that is, how much of what countries produced was meant for export, and how much was meant for domestic consumption. This very large rise demonstrates the growth of global trade during this period, and the deepening economic integration that took place across the world.
We can look at a whole range of measures based to their levels in 1990 to see whether this rise in global trade coincided with improvements in people’s living standards. The figure above, based on World Bank data, demonstrates substantial improvements in things like literacy, pollution control, and hunger reduction.
People who are no longer in extreme poverty still have grindingly difficult lives, but slight improvements in people’s incomes can still make them much better off. Recent evidence from Bangladesh shows that women and girls who lived in villages close enough to work in sweatshops instead of subsistence farming were able to marry later, delay childbirth, and were much more likely to stay in school for longer – effects that were all strongest in 12-18 year old girls.
The figure below shows how unusual the global poverty reductions since the 1970s are, by historical standards. For most of human history we’ve been in a Malthusian trap where only a lucky minority could live in anything more than absolute poverty. We’ve been living through an unprecedentedly good period in human history.
The largest driver of this effect, of course, was China. Beginning in 1978 with agricultural reforms that disbanded communal farms and permitted rural non-farm enterprises, through the decentralisation of control to the state-owned enterprises in the later 1980s, until the full invigoration of the private sector from 1992 with reforms to taxation, property rights, banking and foreign trade and investment, China’s growth has been truly remarkable. Whether the growth was primarily export-led or not is the subject of some debate, but trade was unquestionably a major driver of China’s growth – at least one third of its growth per annum.
Even if we exclude China from the global data, though, the share of people living in extreme poverty still fell from 29% in 1981 to 12% in 2013. Allowing people to move from subsistence farming into factory work has given them higher incomes and a chance to make a better life for their children, mirroring the move that Britain made in the 17th and 18th centuries, and other developed countries made in the 19th century. Countries like the USSR and Maoist China that have tried to strong-arm the switch towards industrialisation have had mass death, famine, and failure.
The global picture between 1988 and 2008 is represented in the figure below, with the horizontal x-axis representing different income percentiles and the vertical y-axis representing how much richer that percentile was at the end of the period compared to the beginning.
This “elephant chart”, originally published by economist Branko Milanovic and named for its supposedly elephant-like shape, showed very strong real-terms growth among the “global middle” and the people at the very top of the global income distribution, but relatively poor or even negative growth among people in the 70th to 95th percentiles (as well as people at the very bottom).
This, it was thought, told the story of Brexit, Trump and Le Pen: a dissatisfied Western working class that had been “left behind” by globalisation. Paul Krugman described it as showing “recent history in one chart”.
But all is not as it seems. Adam Corlett, an economist at the Resolution Foundation, realised that, in Britain at least, the national figures told a different story. Decomposing the data showed that many mature economies had experienced very strong growth – the UK in particular, where every income group experienced nearly 100% real-terms growth in disposable incomes. The bottom 10% saw their incomes rise by over 160%!
What Milanovic’s original chart concealed, Corlett found, was that population shrinkage in Japan and catastrophes in many post-Soviet economies were skewing the data. When those countries were removed from the data set, the world’s developed countries showed decent (if not stellar) growth of between 45% and 60% across the board in this period – with high variations, suggesting that there is nothing inevitable about stagnant incomes for the developed world’s lower middle classes.
The British case
Britain’s growth during this period has been remarkable. Not only have incomes doubled in real terms, the UK has done very well relative to its neighbours in continental Europe. The figure below shows the GDP per capita in the major European economies as a percentage of the USA’s. We use the US as a benchmark to represent the technological frontier – a proxy for the richest a large and diverse economy could be.
What we see is that, from around 1980 (marked by the red vertical line), the UK began to converge with the US and improve relative to Germany, France and Italy. (Note that the German numbers are distorted by including the former East Germany from 1991 onwards, making it less useful as a comparison after that.) This is likely to be a combination of the pro-market Thatcher reforms and the increased openness to trade and competition caused by EU membership. The opposite set of policies saw us fall from being the very richest country in Europe 1800-1950 to being mid-ranking by 1973.
This is useful to bear in mind when considering arguments like this one that the Thatcher reforms were a failure because trend growth after 1980 was slower in Britain than trend growth before 1980. If growth across the developed world happened along these lines, but Britain’s post-1980 growth was unusually strong relative to the others, then we have what looks like quite a strong case that Thatcherism and EU membership were good for Britain’s economy.
Income inequality (the figure above) did rise during this period, but only early on, and it has not risen since. Indeed the ONS recently showedthat income inequality was at its lowest level in thirty years.
Similarly, the wealth shares of the top 10%, top 5%, top 1% and so on have all stayed static since 1980 in Britain, and at historically low levels (the figure below). It should be noted that wealth shares had been falling for the century prior to this, and some may view the levelling-off of this trend as a bad thing, but it cannot be argued that the post-1980 reforms made this worse. I doubt whether inequality is worth focusing on at all, as opposed to the absolute wellbeing of the poor, but in any case the data does not show a big problem here.
The British experience since the crisis has been unpleasant, but much less bad than most other countries. I suspect a large part of this is explainable by our having an independent central bank that eased policy substantially when it needed to (as the US Federal Reserve also did but, catastrophically, the European Central Bank did not), and the labour market reforms that weakened trade union power, making it easier to fire workers and cheaper to hire them.
It’s interesting that, since the crisis, the bottom 20% have done best compared to where they were in 2008. This is not to diminish the importance of raising their incomes more – they are still a lot poorer than the average UK household – but it points to a resilience in the British system that has shielded our worst-off households from economic harm in ways that other countries have had less success at doing.
What’s next
The evidence above does not prove that unregulated markets are always and everywhere a good thing. But it does tell us that the “neoliberal” era of rising international trade and domestic deregulation coincided with astonishing improvements in people’s wellbeing both in Britain and in the world’s poorest countries. Those who want to undo what has been achieved should face extreme scepticism by the rest of us.
The populists and nationalists who are gaining support in many Western countries are doing so after a period of low or zero median income growth since the Great Recession. Though their support falls along cultural lines, their rise cannot be held separately from economic factors.
Trade probably cannot be blamed for the bulk of the decline in manufacturing jobs, which some people hold to be uniquely important. Manufacturing jobs have declined for the most part because automation, not foreign workers, can do the same thing for less. One estimate is that 88 percent of job losses in US manufacturing are because of automation, not foreign competition.
Of course things could be better. But mostly those improvements will come by doing more opening-up of markets to competition, not by closing up competitive ones.
Take the use of land, for example. It’s not obvious to people that there are huge second-order effects that restrictions on land-use create.
These restrictions on what you can build do not just raise the cost of housing – they stop people from moving to where the jobs are, and hold back economic progress in general.
A computer programmer has fewer opportunities to get a high-productivity job or to meet someone she can create a brilliant new iPhone app with in Spokane, WA, than in Silicon Valley. But if San Fransisco rents are so high that she cannot afford to move to where the other programmers are, the wealth she might have created is just gone. In the UK, how many people would like to move to somewhere like London or Cambridge to find better-paid, more productive work – but are prevented by housing costs?
The cost of this effect across the economy can be enormous. Economists Chang-Tai Hseih and Enrico Moretti have estimated that restraints on building new homes in high productivity cities like New York and San Fransisco could be making the US 13.5% poorer than it needs to be, and simply reducing building regulations down to the level of the median US city could increase US GDP by 9.5%, permanently. Britain’s restraints may be even worse.
Here, as with trade, incumbents protected by regulation may be worse off if it is removed, at least in the short term. But the crucial point is that there is not a fixed amount of stuff to be made, or a fixed amount of houses to be allocated. In both cases, allowing new players to compete against incumbents does not just drive down prices, it allows for potentially much greater gains by reorganising what people do in a more efficient and innovative way. There are so many other parts of the economy where this is also the case – we focus on the “seen” winners and losers and forget the longer-run, unseen effects.
Summing up
The case for free markets is that they do a better job of creating wealth than anything else we’ve tried. It does not require us to believe in inviolable property rights or that taxation is theft, or indeed that government always and everywhere is a bad thing.
It does not even ask that we treat human beings’ interests as being roughly equal in importance. If we do, the case becomes a lot more urgent because the lives of the global poor matter to us as well as those of our countrymen. But the nationalistic, selfish case for free trade and free markets stands by itself.
The “neoliberal era” has made Britain rich and has made unprecedented steps forward in improving the lives of the world’s poor. Those people who now threaten to undo it should not just be opposed by free marketeers, but by anyone who wants tomorrow to be better than today.


 The figure above shows global trade as a percentage of GDP since 1960 – that is, how much of what countries produced was meant for export, and how much was meant for domestic consumption. This very large rise demonstrates the growth of global trade during this period, and the deepening economic integration that took place across the world.


