Quote of the day

“I find economics increasingly satisfactory, and I think I am rather good at it.”– John Maynard Keynes

Tuesday, 17 March 2020

Infrastructure, government failure & economic development


Massive African infrastructure projects often hurt, rather than help, local people

Big infrastructure projects are always controversial. Yet in parts of the world associated with severely deficient infrastructure, the positive value of major infrastructure investments is often taken as a given.
This assumption needs to be subjected to much greater scrutiny, as I argue in new research that explores the narrative of Africa’s “infrastructure gap” and why different bodies are rushing to “plug” it. The nature of the relationship between infrastructure and economic growth is already contested. Despite their tendency to produce a short term boom, there is evidence that big infrastructure investments can exacerbate economic fragility.
But such negative impacts are more than economic. While some internationally financed transport projects are very popular with many city-dwellers – such as the light rail in Addis Ababa, regardless of its other failings – others can generate widespread anger and various perverse local impacts. The reality is that the kinds of projects attracting big finance are rarely structured to benefit those who most urgently require infrastructure access.

The mega-road as a barricade

In Nalumunye, a suburb of the Ugandan capital Kampala, some people are so angry about the newly opened expressway carving an impassable barrier through their lives that they refused to take part in my team’s research about it. This is more than mere nimbyism. Those living near the road are furious on the grounds that it is useless to them, has inflated land values for some other people while cutting off their land and swamping it in dust, and offers no easily accessible entry points.
On one side of the road, commutes into the city have hugely increased in length as many people have to travel miles in the wrong direction before reaching a crossing point. On the other, people are cut off from land and families on which their livelihoods depend. Meanwhile, the social character of the area has changed dramatically as speculators swarm in to build luxurious villas. Many of these remain empty as the promised local benefits of the road fail to materialise. Even if they can access the road, ordinary people fear that the toll payments, when introduced, won’t be affordable.
Of course, the expressway has its benefits for regular travellers between the capital and Entebbe airport – though there are growing concerns about continuing low usage a year and a half after its opening. Dubbed the world’s most expensive road, it provides just one among many examples of large, expensive infrastructure projects for which the benefits are increasingly being questioned within Africa.

Mind the gap

Africa is often presented in international media and policy as being held back by absences that need filling. But rarely is much attention paid to different experiences of this “need” or who benefits from filling such gaps. The idea of a yawning African “infrastructure gap” is the ultimate example of this, with the shortfall in infrastructure often estimated in hundreds of billions or even trillions of dollars.
It is true that there are major infrastructure challenges in many parts of Africa. But a careful look at the motivations behind the increased emphasis on this “gap” by a range of financial bodies such as pension fundsinsurance companies and other major global investors is needed.
Since the financial crisis of 2007-09, such bodies have been looking for new kinds of asset to invest in. This has led to Africa’s infrastructure gap being increasingly framed as an investment opportunity. While it is often Chinese-financed infrastructure like the road described above that is currently most visible, a further wave of infrastructure financed by private international capital from the West is on the horizon.
From South Africa to the Democratic Republic of Congo, infrastructure financed through public-private-partnerhips and other forms of “blended finance” are being touted as the answer to Africa’s challenges. In the words of the South African government, such projects “must be large” and must provide a “sufficiently attractive risk profile” for investors.
Yet the popular idea that boosting the global financing of African infrastructure represents a “win-win” for investors and African populations is problematic. There is evidence that the infrastructure that global financiers want to fund, such as toll roads, is not the kind that is most desperately needed by the majority of the population. Much more important are the relatively unglamourous critical infrastructures required to provide safe water, sanitation, drainage and transport accessible to all.

Stoking conflict?

Meanwhile, as the Kampala case shows, big infrastructure investments often push up the value of land as speculators and high-end developers come in. This frequently displaces pre-existing populations.
The rising cost of land and property in urban Africa, especially in rapidly transforming areas on the peripheries of large cities, is also associated with increased land conflicts. In west Africa particularly, it is common for groups of men – known as “landguards” in Ghana or “Omo-Onile” (children of the soil) in Lagos – to base their livelihoods around violently extorting resources from ordinary people attempting to build on urban land, citing ancestral claims to the land as justification.
The boost to land prices provided by infrastructure investments is likely to exacerbate these practices, if not carefully managed. As one Nigerian landowner once noted to myself and a colleague: “Land is the crude oil of Lagos.” Valuable land echoes the idea of a “resource curse” through which abundance in a resource, such as oil, can generate violent conflict. And as wealthy urban property-owners cash in on increased land values, they also form an important political lobby that can block progressive reforms such as increased property taxation. Ironically, this starves city governments of the resources to provide the infrastructures that really matter for the poor.
Instead of presenting African cities as places characterised by absences, it is crucial to understand the interests and everyday practices that exist in these supposed “gaps”. This is not only about considering who will be displaced by mega-infrastructures: it means paying attention to whether they might generate new opportunities for some by preying on or excluding others.
Current “solutions” financed by international investors seeking high rates of return are not only offering limited prospects for the poor. They could even generate new forms of political instability by amplifying inequality and displacement, and fomenting land-based grievances.

Sunday, 15 March 2020

As the Covid-19 pandemic batters economies, you should be thinking about analysing possible responses. This is a complex piece of analysis, but do your best to pick out what you can, and come to me with those bits you can't decipher:

Austerity guru Ken Rogoff tells Boris Johnson to spend, spend, spend his way through Brexit - DT 

The high priest of global austerity has advised the British government to throw caution to the winds and let rip on "good" public spending, warning that it would be deeply misguided to persist with belt-tightening as Brexit D-Day arrives.
"The last thing on earth you should be worried about in the UK is the budget deficit," said Harvard professor Ken Rogoff, normally known as a scold of profligate countries.
"You save for a rainy day, and Brexit is a rainy day. You're about to go through something really unpredictable and I think it would be a mistake not to use your national savings to manage the politics," he said, speaking before the World Economic Forum in Davos.
Prof Rogoff said those caviling over Britain's public investment spree have missed the bigger political picture and are traducing his complex debt theories. 
"Investing in infrastructure is a no-brainer. So long as a good part of the spending goes on investment with a high pay-off – and that includes some types of education – this isn't risky at all," he said. The net UK fiscal boost is 1pc of GDP spread over several years. He described this figure as almost laughably "tame".
"One per cent is nothing compared to what's happening in the US. We have a trillion dollar deficit (5pc of GDP), and if we get a progressive president, it could easily go to $3 trillion. What the UK is doing is not even noticeable in the global conversation," he said. 

Prof Rogoff, an ex-chief economist at the International Monetary Fund, said a host of countries would get into trouble if real interest rates suddenly jump across the world and set off bond market tremors. But the UK is not likely to be one of them.
The British borrow in their own currency, have a sovereign central bank able to take drastic defensive measures in extremis, and have already brought their long-term pension costs under tolerable control.
The greater imperative for the UK at this juncture – when the great liberal democracies are fracturing dangerously – is to bet the farm on social cohesion. "If you don't spend more and spread wealth quickly, there is a risk that voters will turn populist and you'll end up with counterproductive policies that make everything worse," he said.
Prof Rogoff's enthusiasm for a well-targeted fiscal blitz is a valuable endorsement for Downing Street. The Harvard guru is widely seen as the doctrinal author of Europe's post-crisis austerity policies (a fame he dislikes). His magisterial opus with Carmen Reinhart – “This Time is Different: Eight Centuries of Financial Folly” – is a forensic analysis of what can go wrong when countries push their luck too far.
The danger today as global debt reaches an all-time high of 322pc of GDP is that the seemingly inexhaustible supply of ultra-cheap capital will start to dry up, squeezing big borrowers into insolvency. A serious inflation surprise would undoubtedly trigger a sudden lurch upwards in borrowing costs.
"If the global real rate of interest rises 150 basis points over two or three years, anybody saddled with very high debt is not going to be able to pay. A lot of emerging markets are going to default and bond spreads are going to spike much higher in places like Italy," he said.
"It's a tail risk and probably won't happen but when I hear people like Larry Summers and Olivier Blanchard (fiscal enthusiasts) say any shock can only conceivably lead to even lower rates, I have to wonder. We don't really know why interest rates are so low, so we should be very careful about assuming they can't go up," he said. 
A further breakdown of the global trading system could transform the calculus. "It is one thing for hedge funds to make a five-year bet, but countries plan to be around for centuries," he said.
Off-shore dollar debt has surged to $12 trillion dollars – some of it to highly leveraged companies in China, East Asia, or Latin America – and may prove the epicentre of the next crisis. The eurozone still has no lender-of-last resort for sovereign states. The European Central Bank would struggle to justify the legal basis for buying Italian, Spanish, or Portuguese bonds in a post-QE reflation scenario.

Prof Rogoff said the new fiscal craze sweeping the world ignores the hidden costs of higher debt. "It's not a free lunch. The debt that we can see in modern states is just a sliver sitting on top of vast debt obligations. Italy's public pensions take 16pc of GDP. That swamps the official debt ratio," he said.
One implication is unpleasant: pensioners will discover that they are "junior creditors" in many states. Their retirement income will be whittled down in real terms by a disguised debt restructuring. Governments will find some way to wriggle out of their commitments.
Ultimately the implication is that insolvent states will impose big haircuts on bond-holders and creditors rather than confront their peoples with endless austerity.
America will be the last one standing because of the central role of the dollar in the international system, even if Bernie Sanders or Elizabeth Warren take the White House in November, and even if they have enough control of Congress to push through a huge unfunded spending blitz.
Growth might even accelerate until the chickens come home to roost. "Populist regimes can do well, for a while," he said.

Friday, 6 March 2020

UK Labour market

British pay hits new peak

INSECURE “GIG” JOBS ARE STILL ON THE RISE
This month’s numbers on the labour market from the Office for National Statistics represent “a landmark moment for living standards”, says Nye Cominetti. Twelve years since the financial crisis, average pay has finally hit a new peak in real terms. Average weekly regular earnings were £511.60 in the three months to December 2019. The previous peak, adjusting for CPI inflation including owner occupiers’ housing costs, was £511.30, set in August 2007.
That’s clearly good news.  But it’s something of “a bittersweet moment”. It means that, in 12 years, the average pay packet has grown by just 30p.  If instead real pay had continued to grow at its pre-recession trend of 2.1% per year, average weekly pay today would be £141 higher in real terms. That’s an “extraordinary amount of lost ground”. According to the Bank of England, the only comparable pay squeeze in the past 150 years was in the 1920s.
A MIXED RECORD ON JOBS
The jobs picture is similarly mixed. The good news is that employment continues to hit new highs. The employment rate for 16- to 64-year-olds is now 76.5%, reversing the dip seen at the end of last year.  The unemployment rate, at 3.8%, remains at its lowest level in more than four decades.
The bad news is that the number of people on zero-hours contracts is also breaking new records. They total 974,000 in the latest data, amounting to 3% of total employment. This is surprising given the tightness of the labour market – four different measures of the amount of slack all show that there is as little or less slack in the labour market as there was before the crisis. Given this, you might expect workers to “use their bargaining power to secure more standard contracts, given the problems associated with unpredictable hours”.
Self-employment – a far bigger proportion of the workforce than the much-hyped subdivision of the so-called “gig economy” – also reached a record high of 5.03 million – up by about one million since the financial crisis. This is a “further reminder that the rise of atypical work is not just a cyclical effect”, but a structural change in the economy.
We can “cheer the good news and scratch our heads over why it’s taken so long … and resolve to avoid it ever happening again”. But the big picture is that the labour market is both growing and changing – and that that change can bring insecurity for some. To change that, action in the form of labour-market regulation and changes to the tax system will be needed.

Monday, 2 March 2020

Competition again -

This relates to the article on blogger posted on 17th Feb


Thomas Philippon’s “The Great Reversal” spies in tech giants a risk to economic dynamism

Finance and economicsDec 12th 2019 edition


When thomas philippon moved from France to America in 1999 to begin a phd in economics, he found a consumer paradise. Domestic flights were dazzlingly cheap. Household electronics were a relative bargain. In the days of dial-up modems Americans, who were charged a flat rate for local calls, paid far less than Europeans to get online. But over the past two decades, Mr Philippon writes in “The Great Reversal”, this paradise has been lost. Europeans now enjoy cheap cross-continent flights, high-street banking, and phone and internet services; Americans are often at the mercy of indifferent corporate giants. Perking up their economy might mean cutting those giants down to size.
Much that has happened to the American economy since the 1990s has not been to the typical worker’s advantage. Growth in output, wages and productivity has slowed. Inequality has risen, as have the market share and profitability of the most dominant firms. Economics journals are packed with papers on these trends, many of which argue that the dominance of big firms bears some blame for other ills. Between 1987 and 2016 the share of employment accounted for by firms with over 5,000 employees rose from 28% to 34%. Between 1997 and 2012, this newspaper reported in 2016, the average share of revenues accounted for by the top four firms in each of 900 economic sectors grew from 26% to 32%.
Two rival stories vie to explain the rise in concentration. One is that domestic competition has been weakened by lax antitrust enforcement, anticompetitive practices and regulatory changes friendly to powerful firms. This is Mr Philippon’s view. Some economists reckon, though, that concentration is rising because of the success of superstar firms—highly innovative and productive companies that have shoved aside unfit competitors. Either explanation could account for the size and persistent profitability of industry-dominating companies. But the implications of each for future growth—and policy—differ greatly. Which is right?
If concentration is caused by ultra-productive firms outcompeting weaker rivals, then investment ought to rise as those firms scale up to exploit their competitive edge. Investment, however, has been disappointing across the American economy. In the 1990s a statistic called Tobin’s q (a measure of a firm’s market value relative to the cost of replacing its assets, named after an economist, James Tobin) closely tracked rates of net investment. A high Tobin’s q indicates that future profits are likely to be high relative to the cost of expanding production. That suggests leading firms should scale up or see a flood of investment by competitors seeking to divert part of that profit stream. In this millennium, however, investment has lagged behind what one would expect, given the level of Tobin’s q across the economy. A finer-grained analysis shows that the most concentrated sectors account for nearly all the investment shortfall. The change could be caused in part by a shift in investment from tangible capital, such as buildings and machines, to harder-to-measure intangible capital, such as intellectual property, brand value and firm culture. Superstar firms may invest more in intangible capital. But accounting for intangibles, says Mr Philippon, narrows but does not close the investment gap.
Then there is productivity. If concentration is mainly caused by the triumph of superstar firms, it should be rising. Here the data are murkier. The authors of “The fall of the labour share and the rise of superstar firms”, a forthcoming paper in the Quarterly Journal of Economics, find a clear link between size and productivity (bigger firms are more productive) and between industry concentration and patenting (which they use as a proxy for innovation). But the relationship between concentration and measures of productivity is less clear, particularly outside manufacturing. Mr Philippon, on the other hand, finds a positive and statistically significant relationship between concentration and productivity in the 1990s but not more recently. What seems clear is that even as concentration has risen across the economy over the past two decades, the rate of productivity growth has not. If superstar firms are indeed a force for concentration, their unique capabilities have not translated into broader gains for the American economy.
Few economists—or Americans—would deny that there are problems with competition in certain sectors, including health care, finance, telecoms and air travel. The most heated arguments about corporate power, however, concern tech giants. They have not, for the most part, used their market power to raise prices; on the contrary, much of what they provide to consumers is free. The most aggressive invest heavily and eke out rather modest profit margins. Comparisons with Europe are not very helpful, since the continent has mostly failed to produce big and innovative rivals to Google, Apple and Amazon. Would it really be wise for America to carve up its tech champions?

The harder they fall

As Mr Philippon notes, economic power is not all that matters. America’s tech giants have gobbled up competitors and spent lavishly on political donations and lobbying. There is no guarantee that superstars, having achieved dominance, will defend it through innovation and investment rather than anti-competitive behaviour. And even if large platform firms are perfectly efficient, economically speaking, Americans might worry about their influence over communities, social norms and politics.
There is no obvious right answer to the question tech giants pose. It was far from clear, in 1984, whether dismembering at&t would be remembered as a triumph, a fiasco—or simply nothing much. The choice facing American regulators is harder now, precisely because of America’s lack of dynamism. Since innovative, productivity-boosting, socially useful firms come along so rarely, it seems risky to tackle tech behemoths too vigorously, lest doing so weaken the economy’s most vibrant parts. But that reticence may prove a recipe for long-run stagnation.

Sunday, 1 March 2020

Homelessness & austerity

Housing insecurity, homelessness, and populism: Evidence from the UK

Thiemo Fetzer, Srinjoy Sen, Pedro Souza 27 February 2020

A predominant issue facing the UK, and many other advanced economies, is a lack of affordable housing. With an overall inelastic housing supply and flatlining productivity growth, house prices have accelerated at a faster rate than incomes, worsening affordability. In the UK, the share of homebuyers with a mortgage declined from 37% in 2007 to 28% in 2017. This has allowed the private rented sector to thrive. The decline in new homebuyers has been nearly fully offset by a steady rise in the share of households renting from the private sector, which increased from 13% of households in 2007 to around 20% in 2017. 
Housing costs, especially for the lowest income groups, constitute a significant percentage of disposable income, and many OECD countries have social assistance schemes in place to help low-income households with the cost of renting. In the UK, housing benefit provides a means-tested support for low-income households to meet the cost of rented accommodation. The fiscal burden of this welfare benefit – which is mostly a transfer from taxpayers to property owners – is growing and accounted for £21.9 billion in public spending in 2017-18. What happens if such a benefit is suddenly and drastically lowered? 
In a new paper (Fetzer et al. 2019), we carefully trace out the fiscal, social, and economic implications of a drastic and persistent cut to housing benefit in the UK which was initiated by the Conservative-led coalition government in April 2011.

The fiscal shadow of housing benefit in the private rented sector

The Local Housing Allowance (LHA) was introduced in 2008 as a way to compute housing benefit. The aim was for housing benefit to be generous enough to ensure that private sector tenants would be able to afford the median level of rent for a property of specified size in a local housing market (formally, within defined broad rental market areas, or BRMAs). Naturally, linking housing benefits to local rents through the LHA implied that the increase in private sector rents had a direct impact on public spending. From April 2011, the allowance for different sized properties within a BRMA was cut so that instead of covering the median rent, it only covered the 30th percentile. In addition, ‘excess payments’ – whereby housing benefit claimants who had previously lived in slightly cheaper accommodation were allowed to keep the difference in the rent and the LHA applicable, up to a difference of £15 pounds per week – were immediately cut. The cuts implied a significant financial loss for existing housing benefit claimants.
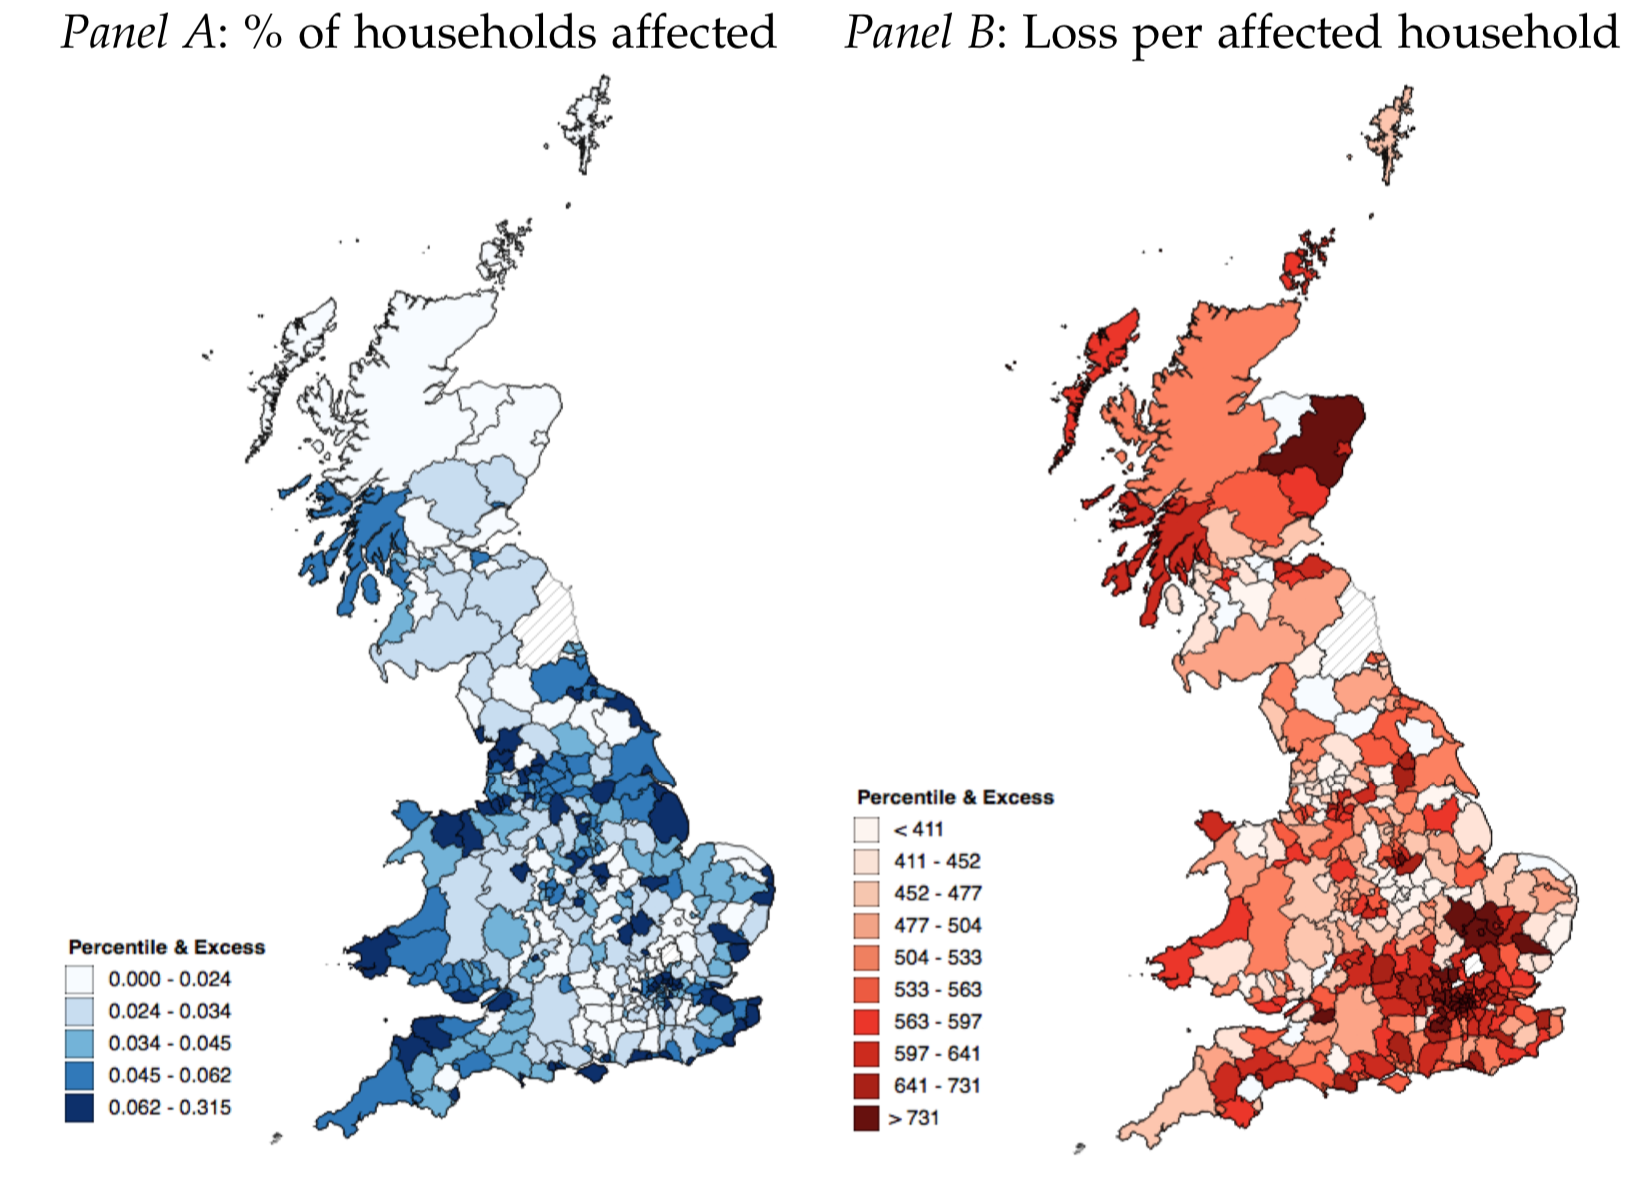
In late 2010, the Department for Works and Pension (DWP) conducted an economic impact assessment of the housing benefit cut using detailed administrative data. Panel A of Figure 1 presents data on the number of households affected expressed as a share of all resident households, while Panel B presents the spatial distribution of the average annual loss per affected household at the district level as observed from the DWP’s impact assessment of the LHA cut. The map highlights that there is significant variation across the UK in the intensity of the cut, with London clearly standing out as being among the worst affected areas. The average exposure to the cut amounted to an annual housing benefit reduction equivalent to £600 per affected household per year, rising to significantly more than £2,000 in many parts of London. Throughout the UK, around 0.9 million households in the private rented sector were affected by the cut – constituting around 5% of all households and up to 25% of all households in the private rented sector.
Figure 1 Ex-ante estimated impact of LHA cut from median to 30th percentile and the removal of the excess
We use these simultaneously introduced cuts to housing benefit to carefully trace out the fiscal, social, and economic impact of cuts to housing assistance. We mostly rely on extensive administrative data, leveraging these ex-ante projections to measure treatment intensity, and study the causal effects of the shock in a differences-in-differences framework with quite relaxed identifying assumptions. 

Effect on evictions, temporary accommodation, and homelessness

We find that a one standard deviation policy shock (a loss of approximately £546 per year per affected household) in private rented sectors led to a 22.1% increase in eviction actions on private sector tenants compared to the pre-reform period, with the numbers being higher in London. There is no discernible impact on eviction actions issued to the social rented sector, which acts as a good placebo test as housing benefit for these tenants was unaffected by the reform. This finding therefore reaffirms that the impact was only observed in the private rented sector, where evictions and repossession actions were carried out, mostly due to rent arrears, as a result of housing benefit claimants in this sector being directly affected by the LHA cuts. 
Households are considered to be in ‘statutory homelessness’ if the local authority considers that they do not have a right to occupy a property, or are at imminent risk of becoming homeless. Local councils have a statutory obligation to provide accommodation to these vulnerable households, which also often have a priority need. As a result of the sharp rise in evictions, we would expect an increase in demand for temporary accommodation which needs to be satisfied by the local councils who bear this statutory obligation. This is also reaffirmed in the data, with a one standard deviation policy shock leading to an increase in statutory homelessness and rough sleeping rates of between 10-13% and nearly 50%, respectively, along with a rise in households being placed in temporary accommodation of 18.8%.
Data provided by councils provide further evidence on who is affected by homelessness and why they became homeless. Since 2011, the structure of statutory homelessness has dramatically shifted, with rapid rises in homelessness concentrated in the working-age adult population and, in particular, among households with children. A one standard deviation increase in exposure to the housing benefit shock is associated with a 25% increase in the number of families with children being classified as homeless. The predominant reason why households become homeless in districts most exposed to the housing benefit cut is (legal) eviction from rented accommodation.

Individual-level evidence

Naturally, studying households in precarious living conditions using survey data is difficult, as these households may be particularly likely to move frequently from one accommodation to another, which may increase the risk that they drop out from such panel surveys. In the Understanding Society Panel Study, we find that between 40% and 50% of private rented sector tenants drop out from the panel study. For individuals that own their property (outright or with a mortgage), attrition rates are much lower at around 30%. Using the Understanding Society Panel Study, we highlight that attrition is likely an important margin: we find that   individuals (likely) exposed to the housing benefit cut were much more likely to drop out from the panel study after the reform took effect. We further show that it is these same individuals who are exposed to the benefit cut that report that they are increasingly falling into rent arrears rent in the most recent wave prior to them dropping out from the survey. This highlights that survey data, which are often used to inform policymaking, may be systematically skewed and not representative of vulnerable sample populations if there is policy-induced selective attrition.
For a small subsample of households that do not drop out from the survey, we further observe that individual-level exposure to housing benefit cuts is associated not only with increased rent arrears but also with a higher propensity to be evicted, mapping very closely to the results obtained from the district-level analysis.

Effect on electoral registration and the EU referendum vote

We also link exposure to the housing benefit cut to measures of democratic participation. The more descriptive results suggest that a one standard deviation increase in exposure to the housing benefit cut is associated with a non-negligible reduction in the electoral registration coverage rate (i.e. the ratio between the number of registered voters in a district and the number of voting-age adults in that district). We further document that a one standard deviation policy shock is associated with a fall in the official electorate for the 2016 EU referendum as a share of the voting-age population of 0.7-0.9 percentage points. The actual turnout for the referendum was significantly lower in districts more affected by the cut, with a one standard deviation increase in exposure to housing benefit cut leading to a fall in turnout of 1.3-1.8 percentage points. Lastly, we also observe that a one standard deviation increase in the level of exposure to the cut in a district is associated with up to a 2.2 percentage point greater level of support for ‘Leave’. This effect is likely driven by the composition of the electorate, as studies since the referendum have revealed that among those that did not turn out in the referendum, support for Remain outnumbers support for Leave by 2:1.

Fiscal neutrality 

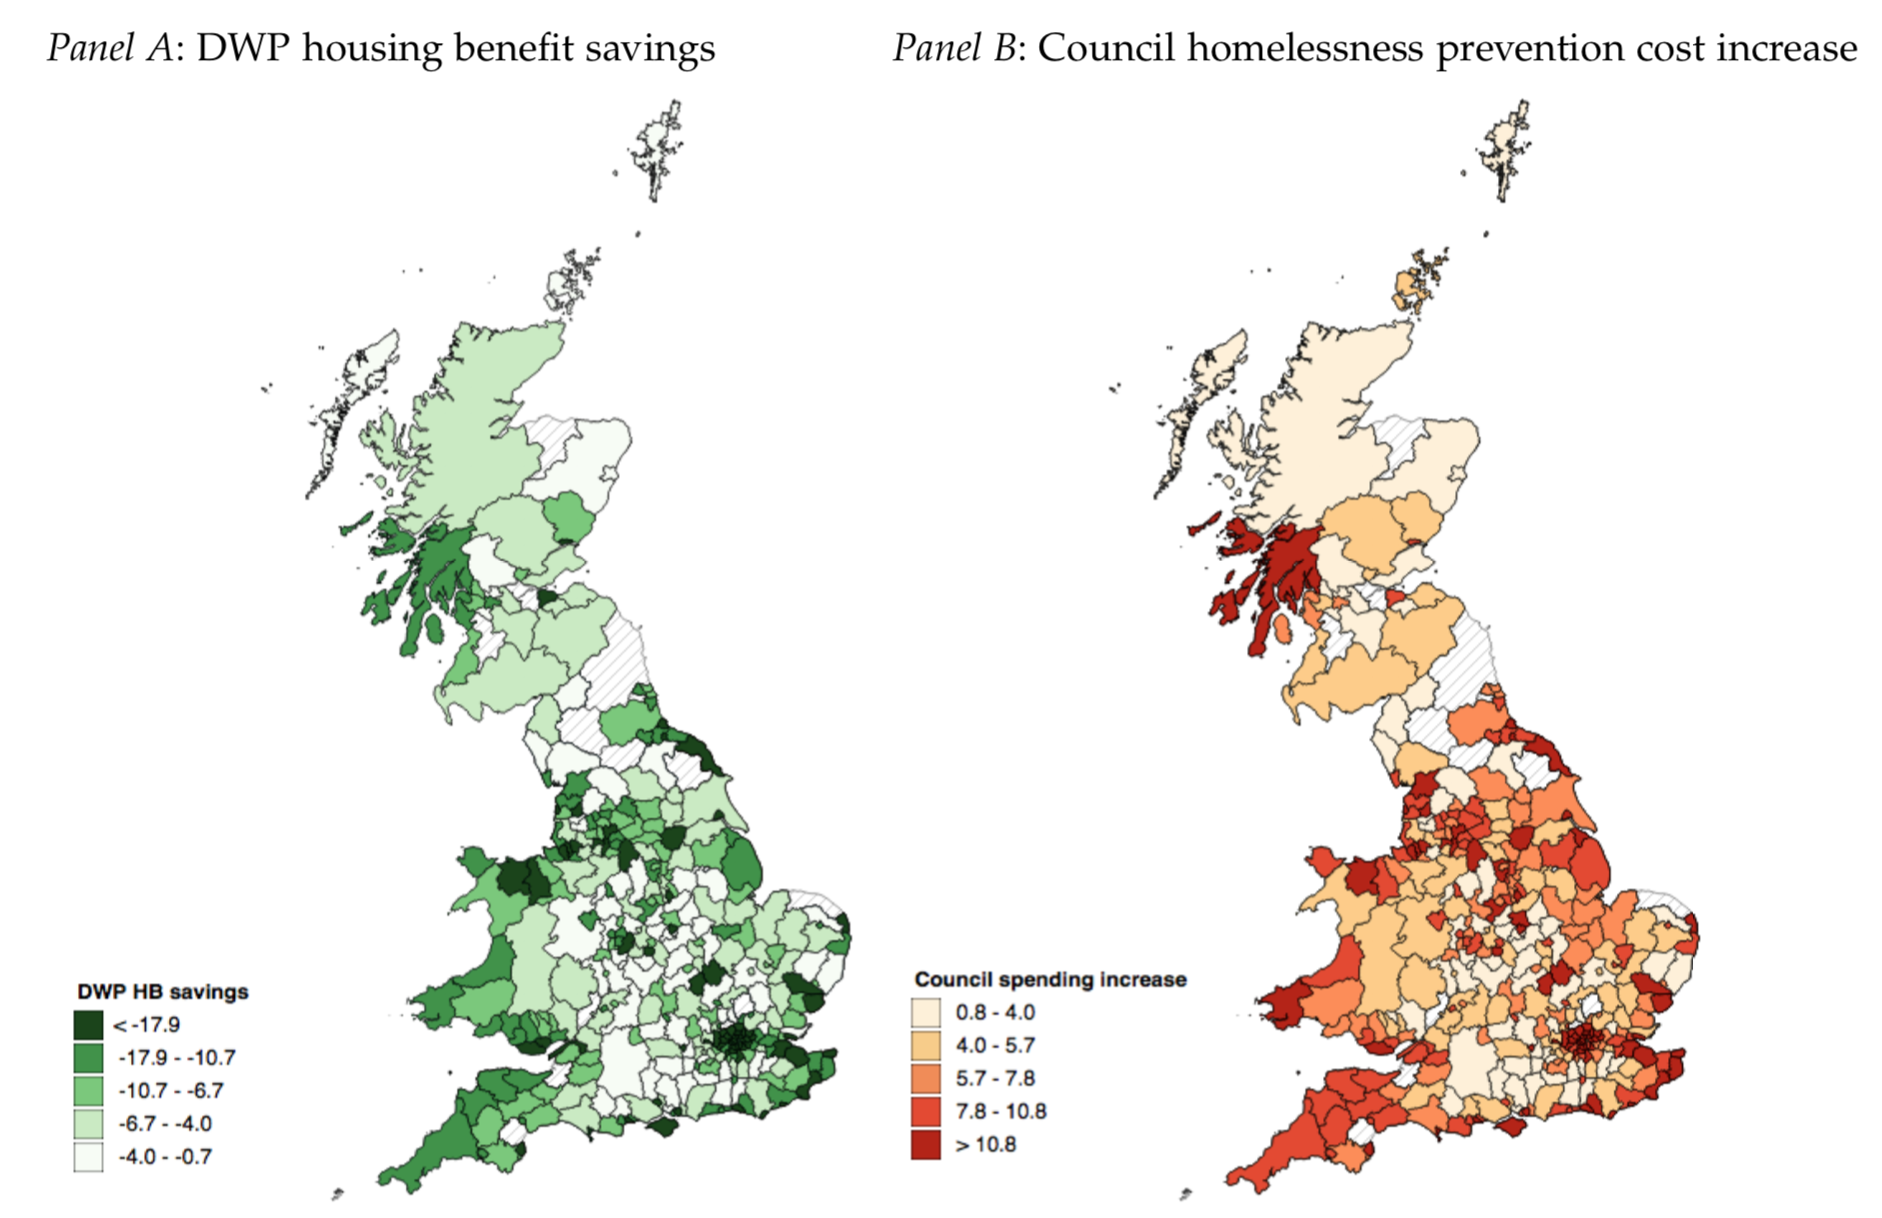
The housing benefit cut dramatically increased statutory homelessness and rough sleeping, as mentioned above. Since local authorities have a statutory obligation to house households that are, or are at risk of becoming, unintentionally homeless, the local authorities had to rent properties, sometimes from private landlords and often at market rental rates, to provide temporary accommodation and other homelessness prevention services. Even though the cut to housing benefits was originally intended to provide fiscal savings to the DWP, we show that a large portion of the savings were offset by local council spending on anti-homelessness measures, thereby leading to a dramatic shifting of the burden from central to local government. This partially defeats the original object of the housing reform, which aimed to reduce fiscal exposure to rapidly rising market rents. Figure 2 illustrates the lower housing benefit spending by DWP and higher local council spending on anti-homelessness measures.
Figure 2 Cost-benefit analysis: Implied fiscal savings to central government from housing benefit cut versus higher council spending on homelessness (pounds per resident household)
Our calculations denote that in the case of the median (mean) council, for every £1 saved in lowering spending on housing benefit, 75p (53p) is spent on preventing homelessness or on housing individuals at risk of becoming homeless in temporary accommodation. The further indirect social and economic costs due to the potential adverse effects on outcomes, especially for children brought up in insecure conditions, likely weigh in even further.

Concluding remarks

Cutting housing subsidies, while appearing to be fiscally attractive, may result in significant economic and social costs. Insecure housing and forced displacement – which, as we show, can directly result from cuts to housing assistance – may result in further social costs such as negative consequences for health (Fowler et al. 2015) or labour markets (Van Dyk 2019), and may also have adverse effects on children’s educational attainment (Humphries et al. 2019, Chyn 2018). We also show that insecure housing may erode democratic participation, increasing concerns over political legitimacy. In that sense, our work contributes to a growing literature that examines the role that housing plays in shaping contemporary political preferences (Ansell 2014, 2019, Adler and Ansell 2020), and in particular the role that welfare cuts may play in shaping political outcomes (Fetzer 2019).

If you think government grants are great:

Crackdown on grant fraud:

Ministers are planning to launch a review into the way business grants are handed out following a rise in fraudulent claims.
The department of business, energy & industrial strategy has approached accountancy giants including KPMG to carry out the review, according to industry sources. No decision has yet been made on which firm to appoint.
The review is likely to examine the system for awarding grants, which critics say is opaque and fails to track the progress of companies awarded cash.
It is also expected to look at rising incidents of “grant fraud”, where public bodies are scammed into giving cash to companies that do not use it in the area for which it is intended. It has been estimated that grant fraud costs the government up to £2bn a year.
Rising concern over fraud has prompted the business support agency Innovate UK, which has funded more than 11,000 projects since 2007, to begin sending officers for “proactive assurance visits” at companies that have received grants to check the funds are being used properly. It works with the fraudbusting service Cifas to crack down on misuse.
Grants are a significant source of funding for small companies. Fast-growing businesses, especially those advancing research in science and technology, have access to hundreds of grants.
However, the application process can often be complex, meaning many founders choose not to apply. Some that do apply become so expert they are awarded multiple grants, leading to accusations that the system lacks diversity.
Many grants and other forms of funding are channelled through local enterprise partnerships (Leps). The 38 Leps have been heavily criticised for failing to show that they offer value for money.
Last year, the National Audit Office said the Ministry of Housing, Communities and Local Government, which funds the Lep network, had “made no effort to evaluate the value for money of nearly £12bn of public funding”.

Some experts believe a way to tackle misuse of the grant system is to invert it, by awarding cash based on end results rather than a business plan.