
Summary
Mortgage rates have been rising along with treasury rates.
Housing data is starting to fall as higher rates make housing less attractive.
New home sales and existing home sales volumes are contracting.

Higher Mortgage Rates Hurting Housing (ITB)
Interest rates have been rising across the curve over the past several weeks. Interest rates on the short end of the curve, 0-5 year duration, have been rising much faster on a relative basis than 20-30 year treasury rates.
Even though the move in interest rates has only taken place over a few weeks, and most of the action has been on the short-end of the curve, the rising rates have already started to impact the housing market. The economic data for the housing sector has started to drastically miss expectations and has moved into contractionary territory.
Even though the move in interest rates has only taken place over a few weeks, and most of the action has been on the short-end of the curve, the rising rates have already started to impact the housing market. The economic data for the housing sector has started to drastically miss expectations and has moved into contractionary territory.
Mortgage rates have risen recently which has impacted the housing market. It is surprising how quickly the impact was felt from such a short move and truthfully, not a big one on the long end.
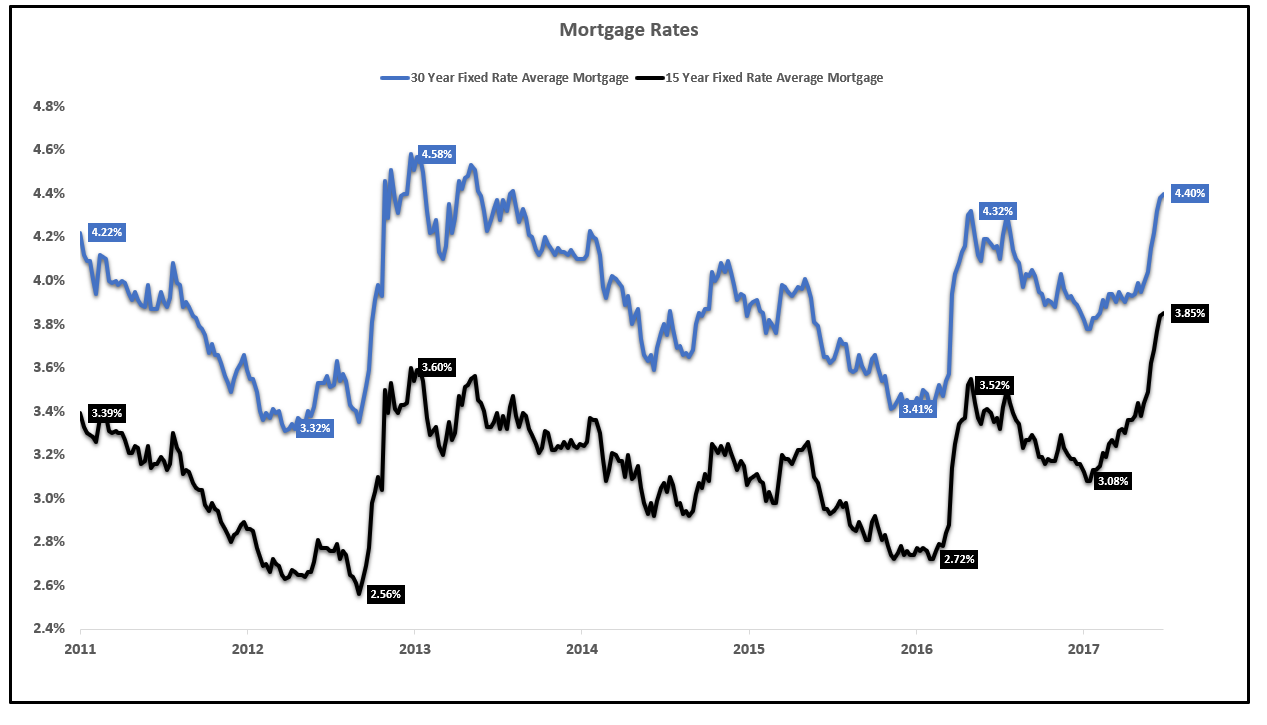
Mortgage Rates:
 Source: FRED, EPB Macro Research
Mortgage rates have risen to an average of 4.40% for a 30-year fixed and 3.85% for a 15-year fixed. These rates are roughly 100 basis points off the lows in 2016. A 100 basis point move in long-term rates has dented the housing market as I will outline below. What would happen if rates moved 300 basis points?
In an over-leveraged economy such as the United States, a small move in interest rates has massive impacts on the rest of the economy. It is for this reason that the economy cannot withstand higher interest rates.
Earlier this week, the Census Bureau released the report on New Home Sales. The New Home Sales report, published by the Census Bureau each month, provides national and regional data on the number of new single-family houses sold and for sale. It also provides national data on median and average prices, the number of houses sold and for sale by stage of construction, and other statistics. New Home Sales, or homes that were just built, make up 10% of the housing market. Existing Home Sales are roughly 90% of the market.
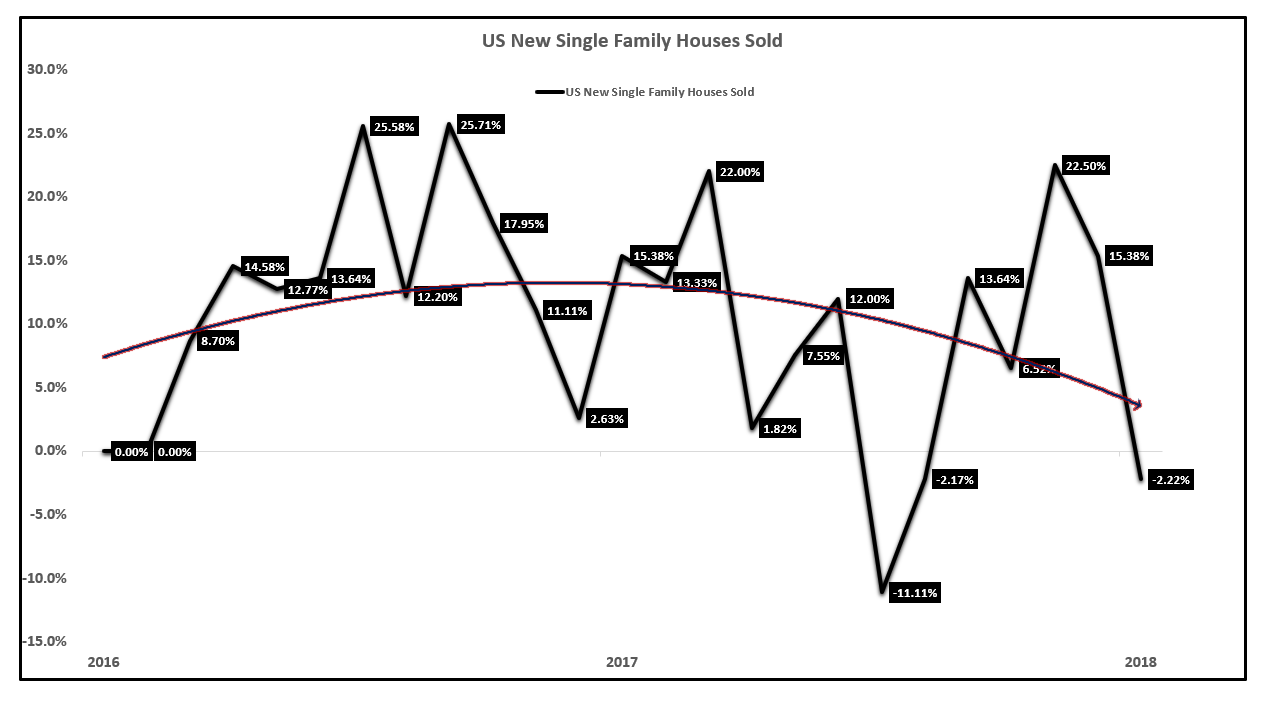
New Home Sales Year over Year Growth:
 Source: Census Bureau, EPB Macro Research
New home sales are falling at an annual rate of 2.2% as of the last report. The trend in new home sales growth is also lower as the chart above shows.
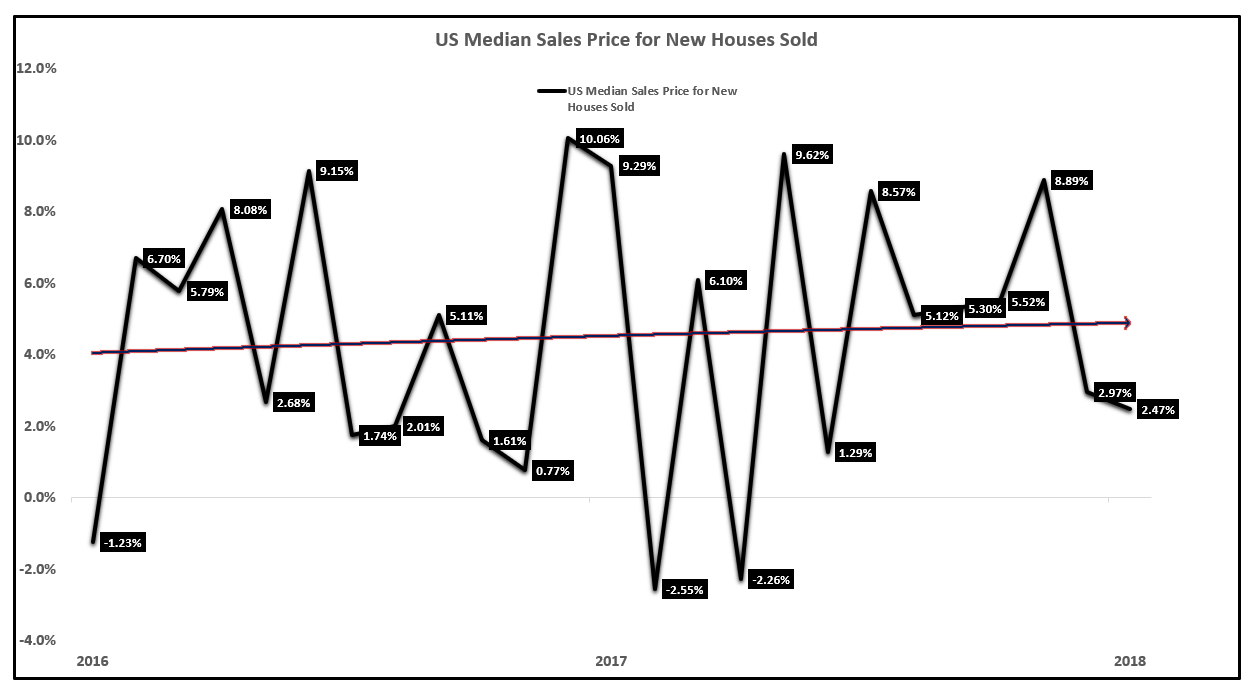
The growth in the supply of new homes is increasing which is going to put downward pressure on prices, on top of the impact of rising mortgage rates.
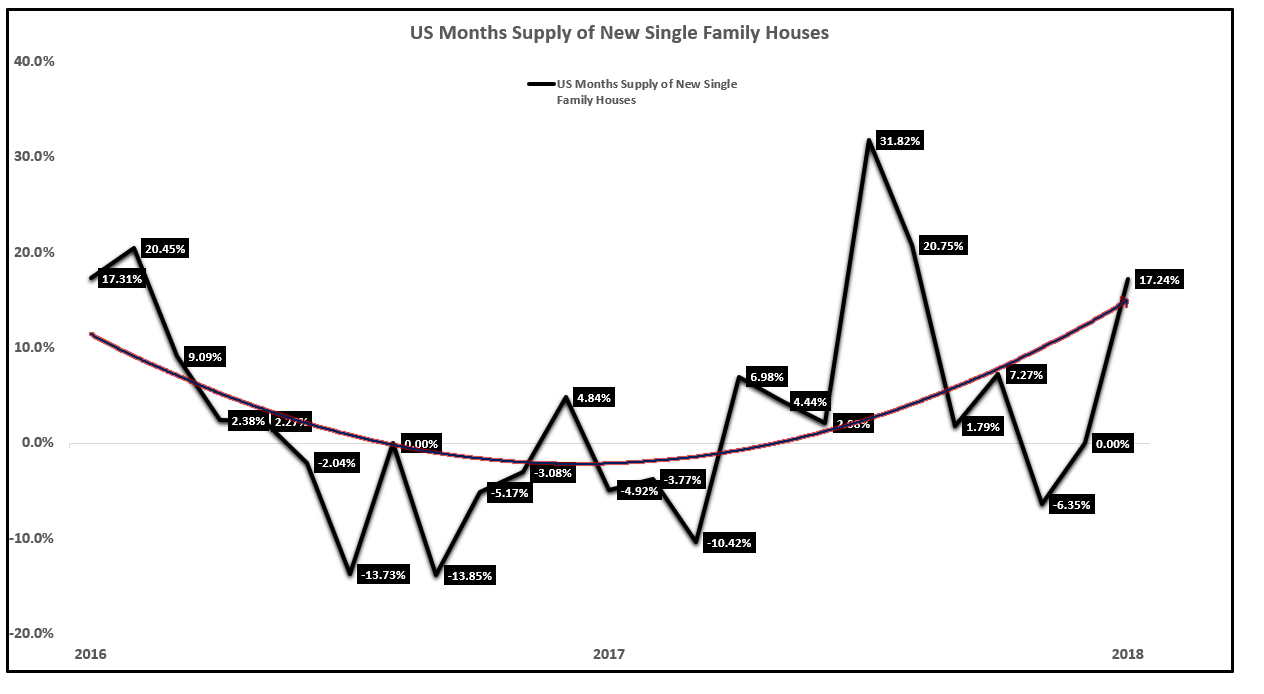
New Home Sales Supply Year over Year Growth:
 Source: Census Bureau, EPB Macro Research
The growth in the supply of new homes is trending higher, increasing at a rate of 17.24% in January after being in negative territory for much of the past two years.
Supply is coming online for new home sales at the end of the economic cycle; this will put heavy downward pressure on prices over the next several months.
New Home Sales Median Sales Price Year over Year Growth:
 Source: Census Bureau, EPB Macro Research
No comments:
Post a Comment