
This post was published to members of EPB Macro Research on February 24, 2018. For more analysis and to become a member of EPB Macro Research, click here.

Debt, Debt And More Debt
Earlier this month, the Board of Governors of the Federal Reserve System released the monthly 'consumer credit report' which outlines the total amount of consumer debt, broken down by category.
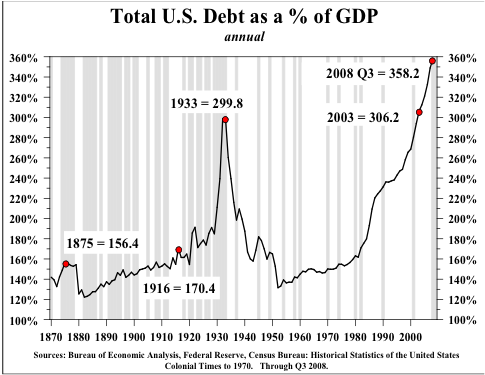
Total Economic Debt to GDP for the United States:
 Source: BEA, Federal Reserve, Hoisington, Census Bureau
Note: Today, total debt to GDP is ~ 370%
Debt across nearly every category of consumer loans has reached record levels. Interest rates rising with increased levels of debt translate to higher interest payments and slower consumption growth. At some point, the economy will not be able to handle the current debt load. Debt is the highest level in the country's history as a percentage of GDP.
Total Nonfinancial Debt to GDP for the United States:
 Source: BEA, Federal Reserve, Hoisington, Census Bureau
The theory of debt deflation, which I will outline at the end of this piece, has proven correct many times in the past and suggests that this level of debt will result in deleveraging and deflation.
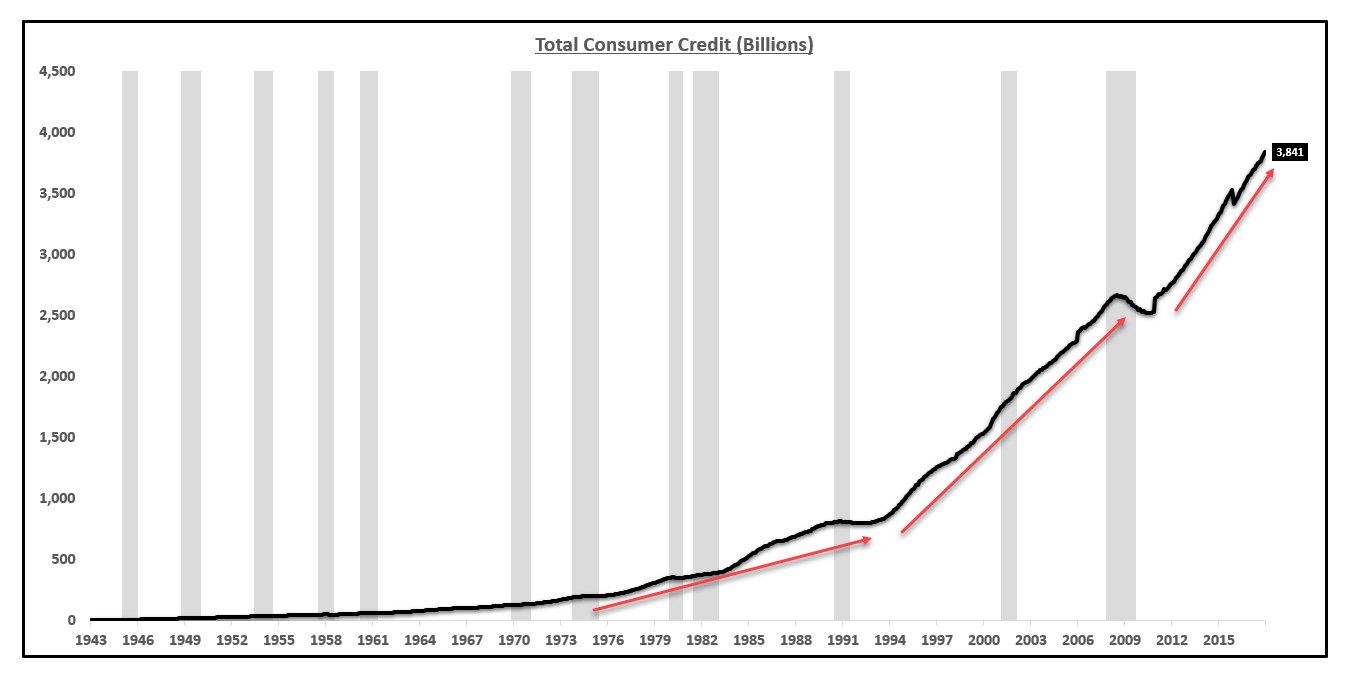
The total level of consumer credit increased to $3.84 trillion which is up 5.4% from one year ago.
Total Consumer Credit (Billions):
 Source: Federal Reserve, EPB Macro Research
Not only is credit expanding at a rate that exceeds income growth, the growth in credit is accelerating. The three red lines in the chart above are increasingly steep indicating that credit is rising at an accelerating pace.
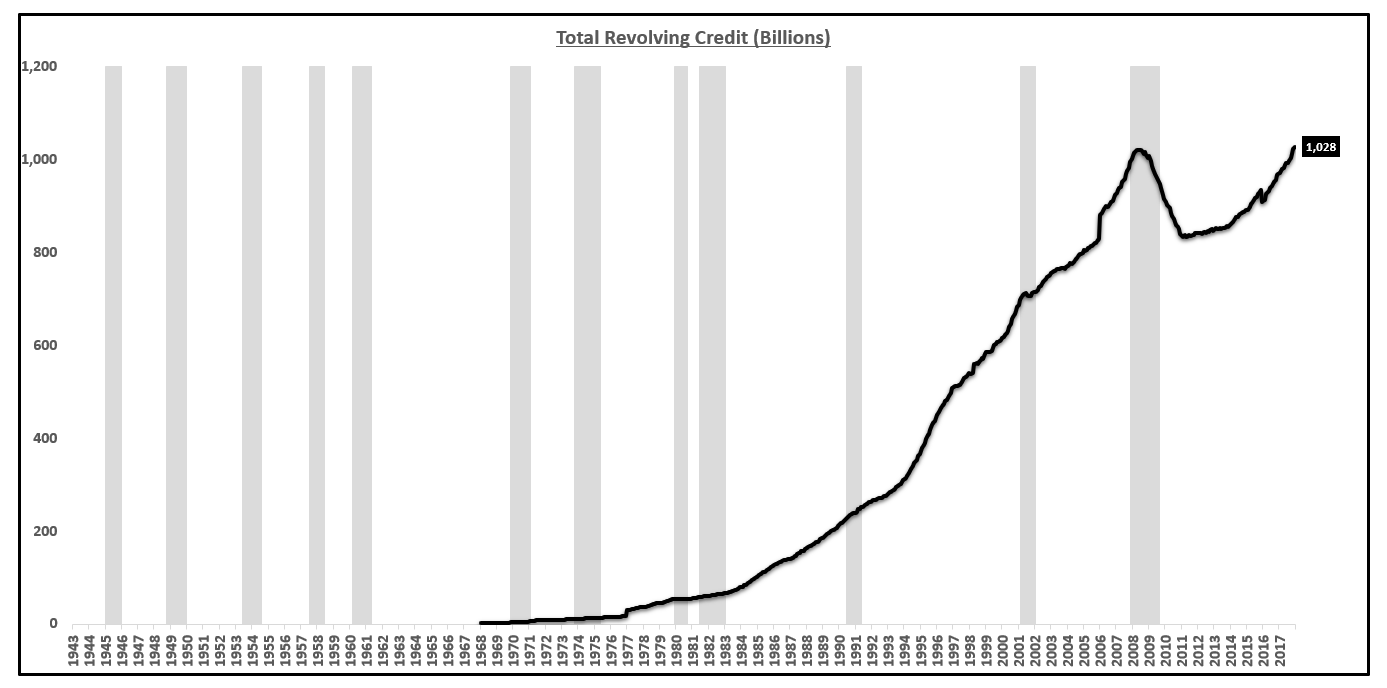
Revolving credit, or more commonly called credit card debt, increased to $1.028 trillion as of this latest report, the highest level recorded, exceeding the 2008 peak.
Revolving credit, or more commonly called credit card debt, increased to $1.028 trillion as of this latest report, the highest level recorded, exceeding the 2008 peak.
Total Revolving Credit 'Credit Card Debt' (Billions):
 Source: Federal Reserve, EPB Macro Research
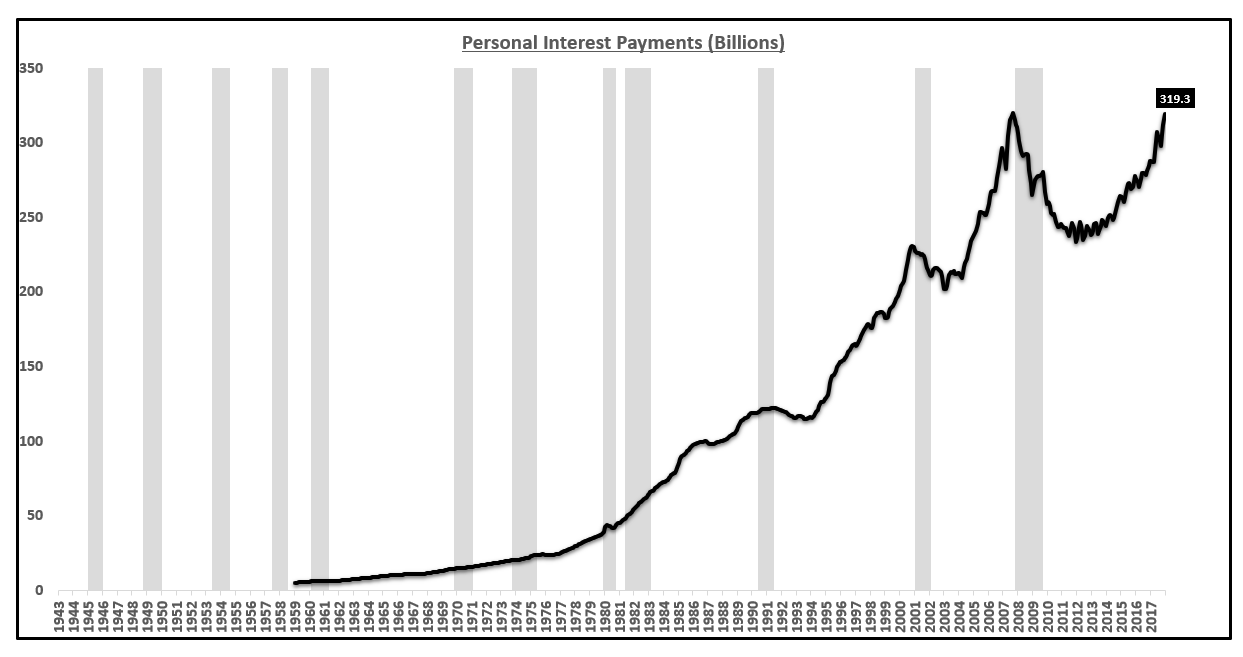
Interest rates have been so low for so long that the consumer has been able to carry a higher nominal debt loan while keeping the interest payments relatively low. The consumer has far more debt today than in 2008 as the charts above show but the total interest payment is roughly equivalent, at $320 billion annually.
Personal Interest Payments (Billions):
 Source: Federal Reserve, EPB Macro Research
Interest rates have started to rise across the curve, more notably on the short end of the curve. If interest rates rise at the current debt level, personal interest payments will far exceed that of 2008.
Below, the average interest rate is starting to trend higher on credit cards based on the Federal Reserve report. Higher nominal levels of debt and higher interest rates will mathematically increase interest payments and take a larger share of disposable personal income from the consumer resulting in lower consumption growth.
Average Finance Rate on Consumer Credit Card Loans:
 Source: Federal Reserve, EPB Macro Research
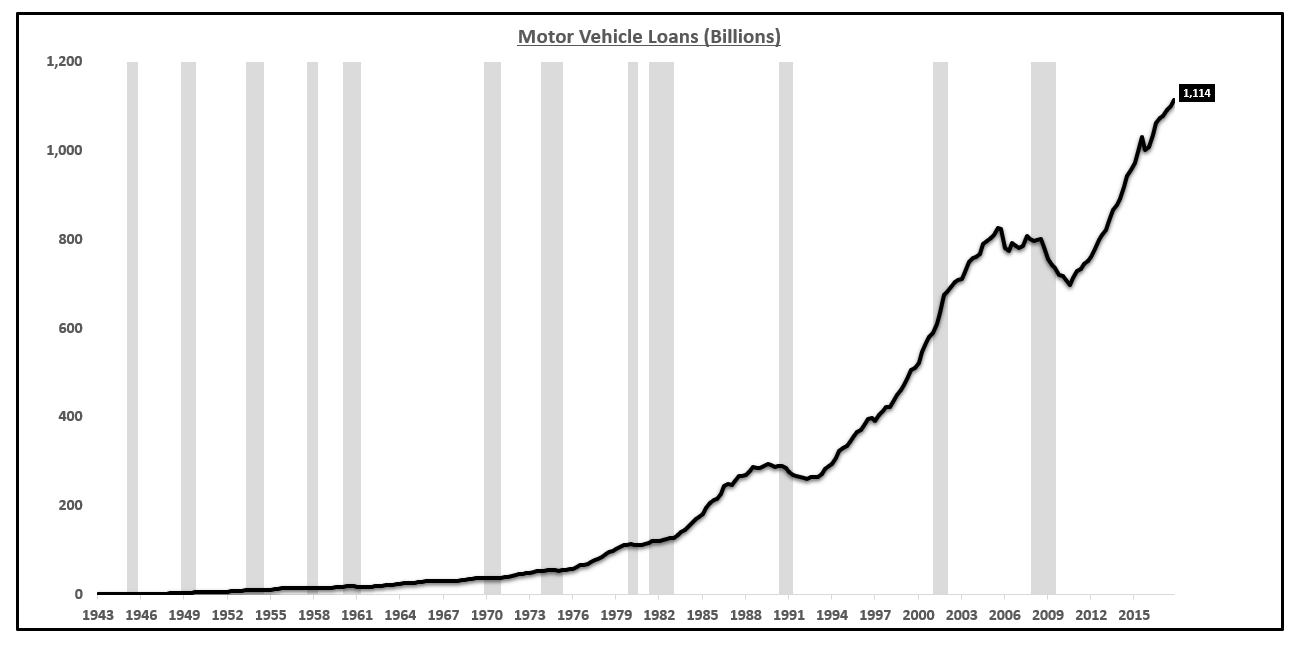
Auto loans have increased to $1.14 trillion, massively above the 2008 peak. Debt soaring across nearly every sector will at some point have adverse effects on the economy, it is a mathematical certainty. Debt pulls forward consumption at the expense of reduced consumption in the future. Credit cannot continue to expand at this pace. A deleveraging will occur.
Auto Loans (Billions):
 Source: Federal Reserve, EPB Macro Research
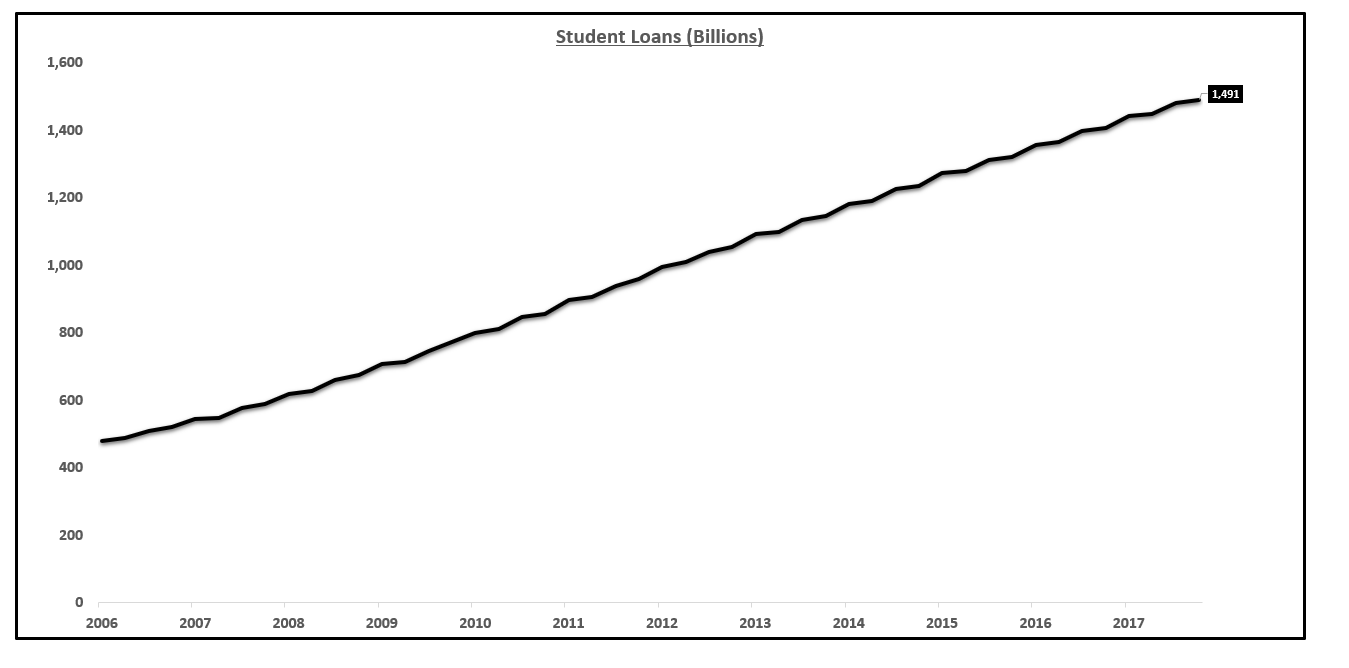
Student loans are the latest category to exceed $1 trillion in outstanding value. The quality of these student loans is notoriously weak which makes this area a very live trigger point during the next economic downturn. Widespread defaults in the student loan space, which seem almost certain to occur due to weak wage growth and rising delinquent balances will cause contain effects.
Student Loans (Billions):
 Source: Federal Reserve, EPB Macro Research
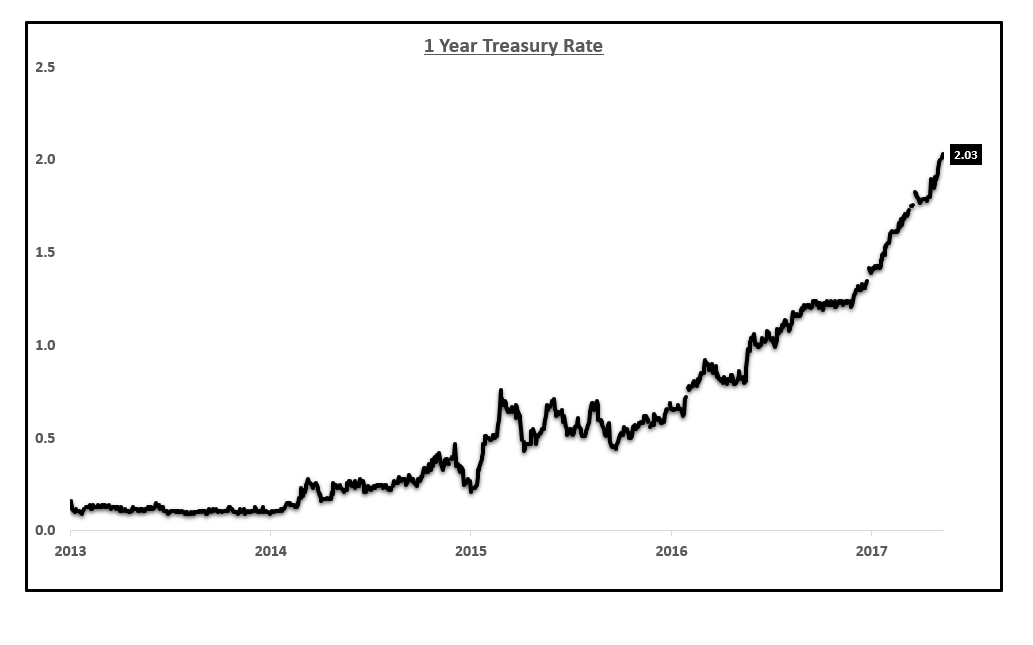
There is no way to predict the day the system finally has too much debt. The trend of higher debt and increasing interest rates poses a very real problem for the economy. The majority of the rise in interest rates has occurred in the past few months.
1 Year Treasury Rate:
 Source: YCharts, EPB Macro Research
It will take time for these effects to play out, which is why the current forecast for a sharp economic slow down in 2018, with the strongest slow down occurring in the second half, continues to be a strong thesis with mounting evidence.
The Theory Of Debt Deflation
Debt deflation is a theory that recessions and depressions are due to the overall level of debt rising in real value because of deflation, causing people to default on their consumer loans and mortgages. Bank assets fall because of the defaults and because the value of their collateral falls, leading to a surge in bank insolvencies, a reduction in lending and by extension, a reduction in spending: the credit cycle is the cause of the economic cycle.
No comments:
Post a Comment