Quote of the day

“I find economics increasingly satisfactory, and I think I am rather good at it.”– John Maynard Keynes
Showing posts with label GDP. Show all posts

Sunday, 19 November 2023

Is GDP What It’s Made Out to Be?


Is GDP What It’s Made Out to Be?

It is a popular myth that “consumer spending drives the economy,” a statement that comes from a misunderstanding of GDP. Gross domestic product (GDP) is the most common measure of the economy. It accounts for the final purchase of goods and services by consumers, businesses, and governments. Since consumer spending represents the largest sector of GDP — a full two-thirds — many media analysts conclude that it is consumption, rather than investment, that drives the economy.

However, the media and Wall Street analysts forget that GDP is not the same as “total spending in the economy.” GDP measures final output only — the finished goods and services that consumers, businesses, and government buy each year. It amounted to nearly $27 trillion 2022.

GDP is an important measure of our standard of living, but it leaves out some important elements of the economy. Most importantly, it omits the value of the supply chain — all the intermediate stages of production that move products and services along the production, wholesale, and retail sectors to the finished product. The value of the supply chain is larger than GDP itself, around $32 trillion this year!

When you include the supply chain, you get what the government calls gross output (GO). The federal government now publishes GO along with GDP every quarter. GO is a much better, broader definition of total economic activity because it measures spending at all stages of production. GO represents the “top line” of national income accounting, while GDP is the “bottom line.” Both are essential to understanding how the economy works.

Using GO as the complete measure of total economic activity, we learn that consumer spending is only one-third, not two-thirds, of GO. Thus, consumption is important, but not as important as business spending along the production process.8 Figure 5 demonstrates how much bigger and more volatile business spending (designated as B2B) is compared to consumer spending.
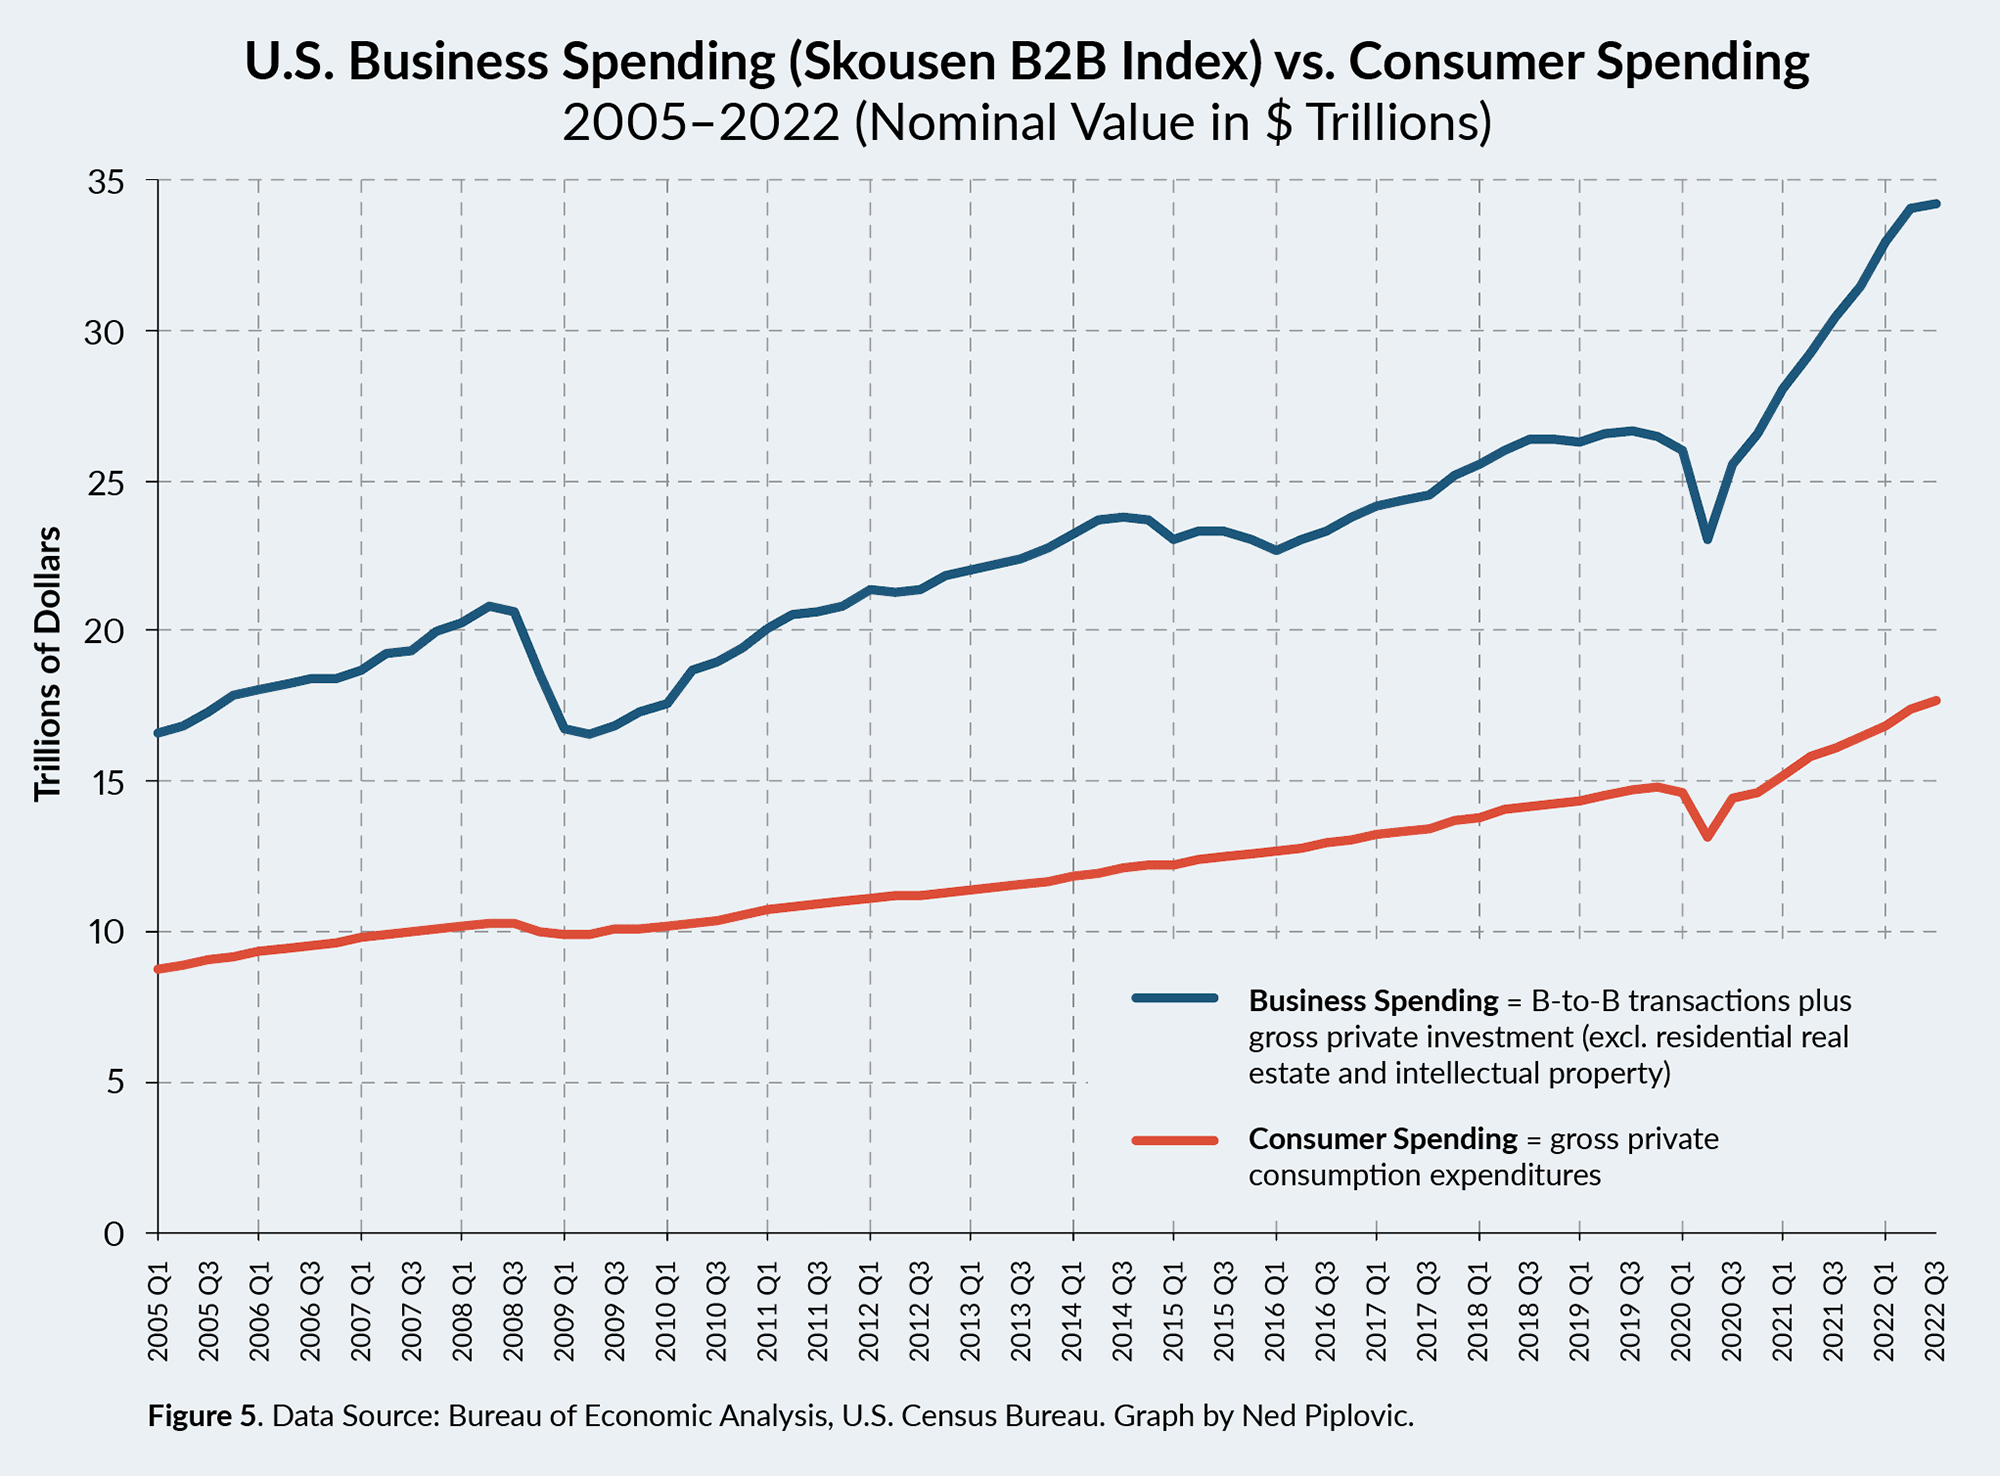
U.S. Business Spending (Skousen B2B Index) vs. Consumer Spending 2005-2022 (Nominal Value in $ Tillions)

Figure 5. Data Source: Bureau of Economic Analysis, U.S. Census Bureau. Graph by Ned Piplovic.

Thus, we see that business activity is the big elephant in the room and it is it that determines the economic success of a nation. Consumption is the effect, not the cause, of prosperity. As MIT professor Shlomo Maital concludes, “The health and wealth of a large number of individual businesses — small, medium and large — determine the economic health and wealth of a nation. When they succeed, managers create wealth, income, and jobs for large numbers of people. When they fail, working people and their families suffer. It is businesses that create wealth, not countries or governments. It is businesses that decide how well or how poorly off we are.”9

In the classroom, I use Seattle as an example. Why is Seattle a booming, prosperous metropolitan city today? Is it because its residents suddenly decided to buy more goods and services with their credit cards? No, it was innovative businesses that came up with new products that consumers didn’t know they wanted until the business engineers came up with the new ideas. I ask students to name these companies. They include Boeing (the 700 commercial jet series), Microsoft (Windows software), Starbucks (new kinds of coffee), and Amazon (the online everything store), among others. Granted, all of these companies needed customers to be profitable and to expand, but which came first, the consumer wanting these products, or creative entrepreneurs who invented the new product? Clearly the catalyst, the first mover, is on the business side of invention — on the supply side.

In economics, this is known as “Say’s Law of Markets,” named after the French economist Jean-Baptiste Say (1767–1832), known as the “French Adam Smith.” Dynamic change and economic growth come from the supply side.

Saturday, 29 July 2023

An alternative to GDP as a measure of a country's growth?

 An interesting idea, but not one that will take off; it might fit into a conclusion, showing broader understanding:

edconway.substack.com
The quest for a better measure of economic progress than GDP has been going on pretty much since GDP was invented, says Ed Conway. Some have suggested life expectancy as an alternative. My suggestion would be to look at the amount of steel a country has. Steel is everywhere. When you travel by train, you are travelling in a steel tube along steel rails using steel escalators and steel lifts to get you to the platform. The more infrastructure you have in your country, the more cars and trains and hospitals and schools, the more steel you have. Simply adding up how much steel there is in use, for which good data exist, and dividing by the number of people, will give you a pretty good sense of how developed that country is. Most developed economies, places such as the UK, US, Japan and most of Europe, have around ten to 15 tonnes of steel per capita. In the UK it’s 13.4. For the US it’s 13.8 and Germany 11.9. China has something like seven. In sub-Saharan Africa, it’s mostly below one. In Mali and Niger, the figure is barely 0.1. “This, to me, is a far more visceral way of explaining development and the gaps between nations than GDP […] And happily, using this metric is far more intuitive (and less prone to things like purchasing-power parity adjustments) than things like GDP per head.”

Tuesday, 13 September 2022

GDP vs GDI - great for evaluation

 Have a read; anything you are not sure about make a note and ask me. I had to read some bits twice to understand them properly. Note it doesn't do capitals for GDP/GDI - this is an anomaly of the software on this page; both should be in caps. If you actually go to the article there is the option to listen to it as a podcast.


A focus on GDP understates the strength of America’s recovery

Gross domestic income, a close cousin, paints a far rosier picture

It is fashionable in some circles to lament the “cult of gross domestic product”. The pursuit of growth, this criticism goes, blinds officials to less quantifiable but worthier objectives, be it a contented population or a clean environment. For many economists, the concern about gdp is very different. They see huge value in the core mission of the measure: namely, to provide as timely and accurate a snapshot of the state of the economy as possible, a lodestar for governments setting policies and for companies making decisions. Their criticism instead is that gdp occasionally struggles to achieve this, and that better alternatives might exist.

This debate has again come to the fore in America because of an unprecedented gap between gdp and its close relative, gross domestic income (gdi). In theory the two ought to be aligned. Gdp tracks all expenditure in the economy, summing up the market value of consumption, investment, government spending and net exports in a specific period. gdi tracks the earnings associated with that expenditure, summing up wages, profits and any other income. In reality the two never match up perfectly, since the long-suffering bean-counters in statistical agencies must draw on different sources, released at different times, to tot them up.

The gap between gdi and gdp (officially known as “the statistical discrepancy”) is typically about 1%. Since late 2020, however, the discrepancy has been much larger. In the first quarter of this year America’s gdi was fully 3.5% larger than its gdp. That is much more than a rounding error. As Ben Harris and Neil Mehrotra of the Treasury Department wrote on May 26th, when the latest gdi data were released, it results in remarkably different pictures of the economy. If gdp is the better reflection of reality, economic output is still about 2% below its pre-pandemic trend. If gdi is accurate, the economy is 1.2% above trend, a far stronger recovery.

One approach to reconciling gdp and gdi is just to split the difference. In 2015 the Council of Economic Advisers in Barack Obama’s White House laid out the case for doing so, calling the average the “gross domestic output” (gdo). The crucial point is that both gdp and gdi derive from entirely independent gauges of output. Combining them should, on average, reduce measurement errors. Mr Obama’s advisers found that gdo was an excellent predictor of later revisions to gdp. For instance, when gdo growth is half a percentage point faster than gdp growth, it is associated with a subsequent upward revision to gdp growth by roughly half a percentage point. This observation is slowly creeping into mainstream thinking. The Bureau of Economic Analysis has started publishing the simple average of gdp and gdi, though few journalists or analysts bother to mention it in their reports.

Accounting for the huge discrepancy at present is somewhat trickier. A useful starting point is the observation that the gdi-gdp gap opened up at the height of the covid-19 pandemic as the government’s stimulus flowed into the economy. The sudden infusion of cash through transfers to households and loans to businesses appears to have messed up conventional measures of economic activity. Corporate profits have been uncharacteristically strong, explaining the vigour in gdi. In principle that should have been mirrored in much more robust gdp readings, too.

Matthew Klein, the author of “The Overshoot”, an economics newsletter (and who worked at The Economist a decade ago), reckons that an undercounting of business investment in gdp may be the most likely cause. Statisticians have struggled to keep tabs on all the newfangled ways that companies spend money, from software to cloud computing. During the pandemic entire business models were upended to accommodate online shopping and remote working; it stands to reason that investment data may have failed to capture such spending.

Another possibility, running in the opposite direction, is that incomes have been overstated. Some people and even businesses may have mistakenly inflated their incomes, at least in a statistical sense. Dean Baker of the Centre for Economic and Policy Research, a left-leaning think-tank, noted back in 2011 that there was a correlation between asset bubbles and gdi. When the stockmarket soars, as it did during much of 2020 and 2021, gdi tends to outstrip gdp. Capital gains are not supposed to count as income in gdp calculations, as they reflect the prices of existing assets rather than production of new ones. But the pattern suggests that people sometimes may misreport capital gains as ordinary income.

Nerds to the rescue

The uncertainty about whether to blame the discrepancy on undercounted business investment or overstated income does seem to argue in favour of the simple gdi-gdp average as a measure of economic output. That, however, is not entirely satisfactory. In a paper in 2010, Jeremy Nalewaik, then an economist with the Federal Reserve, showed that gdi was generally closer to the mark than gdp in registering fluctuations in the business cycle. It did a better job of documenting the true extent of the downturn in 2007-09. Moreover, its outperformance relative to gdp over the past two years is also more consistent with the run-up in inflation. Policymakers who had paid more attention to gdi may have become more concerned sooner about economic overheating.

Frustratingly, initial GDI estimates come out a month after the first gdp figures. But researchers are on the case. In a paper published in January by the Cleveland Fed, economists pulled together gdpgdi and a basket of monthly indicators such as the unemployment rate and average hours worked in manufacturing. The result, they hope, is something closer to “true gdp” that can be updated on a monthly basis. Encouragingly, it performed well in documenting the recovery from the pandemic. If it proves itself over time, it will be one more in a dizzying array of indicators to keep track of. But the message is clear: a focus on conventional gdp alone is unduly restrictive at best, and misleading at worst. 

Saturday, 3 July 2021

Important piece on changes to GDP measurement


If it’s all about the data, a new way of measuring paints a completely different picture of growth

The Times
Share
Save

Every so often new evidence emerges to remind us how little we understand the economy. Not in terms of what the future holds, but the shape of the economy now. In recent weeks, there have been a couple of such double-take moments — reminders that we know even less about what’s going on than we thought.

The first of those surprises came from the European Union settlement scheme, under which EU migrants can apply to remain in the country permanently. During the Brexit negotiations, the plight of the three million EU citizens in the UK was front page news. When the deadline closed on Wednesday, 5.2 million of those three million had been granted the right to stay and another 500,000 were being processed.

That’s right. It turns out there are 2.7 million more non-Irish EU migrants in Britain than was thought during the referendum, and 2.2 million more than the Office for National Statistics’ estimate in mid-2020. The overshoot was so large that Jacob Rees-Mogg this week felt it necessary to pay tribute to deluged Home Office officials.

CHRIS DUGGAN

Where were they hiding? In plain sight. We just had not counted them. Speaking to the Resolution Foundation think tank on Thursday, Sir Charlie Bean, the former Bank of England deputy governor, said: “It’s always struck me as bizarre that we are an island yet we’ve never had a good handle on how many people are here because we’ve never really measured migration.”

Assuming no over-counting elsewhere, the discovery of these lost residents has big implications. For a start, questions may be asked about the economic benefits of migration if more were needed to deliver the same output. A larger total population means national income per person is lower. That would make Britain economically weaker than thought, with an even worse productivity record. Or perhaps we have a thriving shadow economy of crooks and money launderers.

The ONS says the two datasets are not comparable, that 5.7 million probably overstates the true figure as many left in the pandemic (informed estimates suggest 500,000) and that the ONS’s 3.5 million estimate was never the full picture. Either way, all we know is that the official estimate for EU citizens in the UK appears wrong by a factor of 50 per cent.

Measurement matters. Policy is guided by data, which is why the second revelation is even more important. This week, the ONS unveiled a new way of calculating GDP. The changes were technical but significant. What they showed was that Britain’s manufacturing sector, all too often unloved against services, has been a far stronger driver of the UK’s economic engine than thought.

In aggregate, the size of the economy is unaffected but the story of how we got to where we are today is different. Two decades of economic history have changed and the new methods raise the possibility of a better tomorrow.

To understand the changes, though, we first have to tackle the complex subject of “double deflation”. There are two main measures of national income — nominal, or cash, GDP and real GDP. Real GDP growth, which strips out inflation to reveal the volume increase in the economy, is what we all talk about.

SPONSORED

Say a car manufacturer makes £200 million one year and £220 million the next but sells the same number of cars in both. From a GDP perspective, cash growth would be 10 per cent but real growth would be zero as the extra revenue was only in the price. But if the manufacturer added a stereo to the cars in the second year, the quality improvement would be treated as an increase in volume. In economic terms, the £200 million cash GDP would translate into, say, £202 million in real GDP because the “deflator” would now be smaller. This hypothetical auto economy would now have seen 1 per cent real GDP growth.

What the ONS has done, in a painstaking but long overdue piece of work, is create a new set of deflators for each industry, both for their input costs and their output prices, to establish the real economic value they have added. This has transformed the telecoms services sector, the old phone companies that now supply superfast broadband.

Telecoms prices have barely risen but data has multiplied. The ONS has begun adjusting to reflect units of data. Imagine each of those cars had not just been fitted with a stereo but could also fly. As we get so much more for our money, the effective price has fallen, which conversely means the volume measure has exploded. This quality effect means real growth in telecoms has averaged 27 per cent a year since 1998, not the 6.8 per cent previously estimated.

Unfortunately, that vast growth does not mean the economy is bigger. What’s happened is that growth attributed to other industries under the old measurement methods has been shifted to telecoms. This is where double deflation comes in. As the telecoms deflator raises the effective input cost for companies using broadband, their volume growth falls. Architecture, for example, was thought to have grown at 1.9 per cent a year between 1998 and 2018. The new deflators now suggest the industry has not grown at all.

Like telecoms, double deflation has revealed hidden real growth in manufacturing, which accounts for a tenth of GDP and is now thought to have expanded at 3.1 per cent a year in the decade to 2008 rather than 0.3 per cent. Productivity between 1998 and 2018 has been upgraded sharply in manufacturing and downgraded in most services.

The economy is no longer what it was. Measurement changes mean telecoms, technology and manufacturing are the fast-growing industries. Services, still four fifths of national output, remain key but the balance has tipped a little.

It may be no coincidence that the UK is the only G7 country not using double deflation and is sitting at the bottom of the productivity pack. Previous analysis suggested Britain’s factories have been responsible for much of the productivity slowdown. With double deflation, they may become part of the solution.

Either way, pity the policymakers. They can only be as good as the data they are given.

Philip Aldrick is Economics Editor of The Times

Wednesday, 13 January 2021

Nollidj....


Britain’s slump isn’t all it appears

Ed Conway
The Times

The UK suffered the biggest slump in 2020, according to the OECD club of nations, with GDP falling at an annual rate of 9.7%, worse even than Spain (8.7%), says Ed Conway. But while the report seems to confirm the idea that the UK has suffered a “uniquely dismal fate in the face of the virus”, there is a more likely explanation: that the figure reflects the way we calculate GDP. Back in 1997, when Gordon Brown started “pumping money into public services”, the more he spent the more GDP rose “because public-sector economic output simply equalled what we paid for it”. It made “no allowance for quality”. To reflect productivity better, the Office for National Statistics therefore began to base public-sector output on a basket of measures including elective operations and teaching hours. International bodies urged other OECD nations to do likewise, but it seems that few bothered. We don’t know for sure, but what we do know is that there is “no comprehensive benchmark” for the way GDP is calculated, and since government activity accounts for about one in every five pounds of Britain’s GDP, this matters. Viewed in this light, we can upgrade our slump to just “one of the worst”: hardly good news, but “one has to take what one can”

Wednesday, 9 December 2020

A look at economic data across economies, and...

 A long, hard look at the China data. This is a challenging read, but it does explain some of the reasons you cannot compare headline Chinese data with the rest of the world:


There Is No Chinese Economic Miracle

TAGS Economic PolicySocialism

12/04/2020

Listen to the Audio Mises Wire version of this article.

The year 2020 will be an extremely tough year for the European economy. Added to an unprecedented drop is a strong impact in the fourth quarter due to the new lockdowns. Morgan Stanley estimates that the eurozone’s GDP will fall by 2.2 percent in the fourth quarter, a 7 percent drop in the full year 2020. In addition, the investment bank has lowered the outlook for 2021, with a rebound of only 5 percent in the average of the euro area, delaying the recovery of 2019 GDP to 2023.

The “jobless recovery” is even more worrying. The apparently spectacular rebound data for the third quarter resulted in zero job creation. Unemployment in the eurozone in September stood at 8.3 percent and in Spain at 16.5 percent, not counting the millions of furloughed jobs in Europe.

In this environment, the United States’s recovery seems much stronger. GDP recovered in the third quarter to just 3.5 percent below 2019 levels. Unemployment has fallen to 6.9 percent in October but remains well above the record employment levels of 2019.

However, the data from China is apparently spectacular. The manufacturing and services index already shows an enviable expansion. GDP for the first three quarters is already growing at 0.7 percent after an expansion of 4.9 percent in the third quarter. Urban unemployment in China is 5.4 percent after shooting to a paltry 6 percent. What is behind the Chinese miracle compared to the poor eurozone?

A planned GDP. The GDP of China is dictated by production, not demand. It is not an observed GDP, but rather planned by the federal government together with the provinces. For this reason, many analysts scrutinize the data and deduct various factors, including the increase and valuation of inventories. It is not by chance that inventories of iron ore, automobiles, and finished goods have risen to the highest level in seven months as the economy recovers. If the economic situation were in the announced expansion, inventories would be falling rapidly when sold. Much is produced that is then not sold and remains in warehouses. Thus, it is not surprising that industrial prices fell 2.1 percent in September, export prices 0.9 percent, and the country’s debt soared 13.5 percent amid an apparently miraculous recovery. Industrial business profits have fallen 2.4 percent between January and September and, furthermore, factory door prices fell faster than expected in September and were at risk of deflation. These are signs of a slowly recovering economy, like all others, but not of a growth miracle.

In most economies, inventories are valued at market prices, while in China they are valued by the authorities and adjusted later. Constant methodological and base changes also lead to doubts regarding annual growth, despite the evident increase in transparency in recent years. Another difficult factor to analyze is the growth of construction activity in a country where overcapacity is evident and ghost cities and white elephant uneconomical projects are multiplying.

The reduction in urban unemployment also hides a more complex reality. Unemployment in China is close to 11 percent on average, according to the "Long Run Trends in Unemployment and Labor Force Participation in China" study (NBER Working Paper No. 21460) and probably well above 13 percent in the midst of the covid-19 crisis. 

According to Capital Economics, Nomura, or HSBC University of Beijing, another important challenge is calculating GDP with a realistic deflator. By using a deflator—the impact of prices on GDP—that is much lower than the observed one, GDP appears artificially higher than it really is. In an economy where inflation is underestimated, nominal wages, which grow at an official 3.6 percent, lose purchasing power almost every year due to the real cost of living, especially in food and daily expenditures, which are much higher than the official ones.

In a recent study ("A Forensic Examination of China’s National Accounts" [2019]) the authors concluded that China’s GDP may have been exaggerated by around 2 percent per year between 2008 and 2016, showing that China’s real GDP is probably 18 percent lower than the official figure. China’s GDP is never revised, and the December figure simply stands and is consolidated without question. This is an important factor that the Chinese authorities have tried to correct with greater transparency and adjustments by the NBS (National Bureau of Statistics). The problem is that provinces have accelerated their race in the effort to provide spectacular figures and the magnitude of the corrections of the national office does not compensate for these “exaggerations.”

Another problem is that annual revisions compute for growth but are not revised in the GDP figure for the year. The calculation base is reduced. For example, according to independent consultancy China Beige Book, gross capital formation for the third quarter of 2019 has been revised down by ¥2.3 trillion. As the 2019 figure falls, the growth on the same data for 2020 seems spectacular. That same review was made with the retail sales figure: those for August 2019 were revised down by ¥50 billion and the growth figure for 2020 seems miraculous. However, a revision of such depth in the base calculation of figures for 2019 did not generate a downward revision of the GDP for that year.

These methodological problems are added to the survey used for the calculation. The government uses a list of companies that generate a minimum amount of revenue. That list grows and shrinks, creating homogeneity problems that the NBS tries to adjust for.

In the United States, each daily, weekly, and monthly data is analyzed by different independent entities and each data point is impossible to manipulate by a government authority. That is why the GDP is constantly revised. China’s GDP is the only one that is not revised. It is published and consolidated.

It is a shame because the reality observed by companies and citizens in China is that the economy is recovering slowly and unevenly, but it is recovering, probably with a year-on-year drop of 2.5 percent, which would be, in any case, a very positive figure. Falling into planned overcapacity and excessive triumphalism on the part of some provinces competing to provide better data than others ends in questioning the reality of the improvement in the economy.

Beijing has pledged to bring the data up to IMF standards, but lack of independent scrutiny and the competition between provinces when it comes to providing positive and spectacular figures continue to generate inconsistencies between sales, inventories, consumption, and profits. The recovery of the real economy in China is happening, but it is not dissimilar to that of many of the leading Asian countries.

Author:

Daniel Lacalle

Daniel Lacalle, PhD, economist and fund manager, is the author of the bestselling books Freedom or Equality (2020), Escape from the Central Bank Trap (2017), The Energy World Is Flat (2015), and Life in the Financial Markets (2014).